202320232023
Drought Interfaces
An interface for modeling water rights given water scarcity in the Colorado River Basin.
Certain Measures Wright-Ingraham Institute
Systems Designer, Project Lead
About
The Wright-Ingraham Institute invited us to propose a tool for drought in the Colorado River Basin. Complex natural forces and political interests that shape water in the region -- legal, economic, cultural, and ecological -- were unpacked and integrated into a model. The tool acts as piece of socio-technical infrastructure representative of the socio-technical problem of water scarcity, accounting rigorously for existing historical and existing conditions to construct a surface for testing different scenarios for allocating of water and water rights across the seven states who must collaborate in its management.
Research Brief
Starting with the paper written by The Wright-Ingraham Institute's research arm, StudyTank, as a driver, the domain of drought was initially conceived as the difference between allocated and actual water availability in the region. The legal allocation of water is defined in the Colorado River Compact.
These two documents and its positions undergirded the production of the interface.
The paper outlined conditions of the basin while also analyzing the insufficiencies of Colorado River Compact for water management. The interface was a response to the paper.
These two documents and its positions undergirded the production of the interface.
The paper outlined conditions of the basin while also analyzing the insufficiencies of Colorado River Compact for water management. The interface was a response to the paper.
01Research Brief
01
01Research Brief
System Analysis
Systems are large and nebulous. The first phase focused on setting the groundwork for the system for scoping downstream. The paper was deliberately used as boundary for the system. Gaps between concepts were identified for further research. Concepts were both structured and integrated into a rough system model.
The goal during this phase was to work from the domain all the way down to the data through the process of decomposition, and to develop through conversation a common understanding of the system. Diagrams facilitated these conversations and areas of interests were flagged for additional research.
The goal during this phase was to work from the domain all the way down to the data through the process of decomposition, and to develop through conversation a common understanding of the system. Diagrams facilitated these conversations and areas of interests were flagged for additional research.
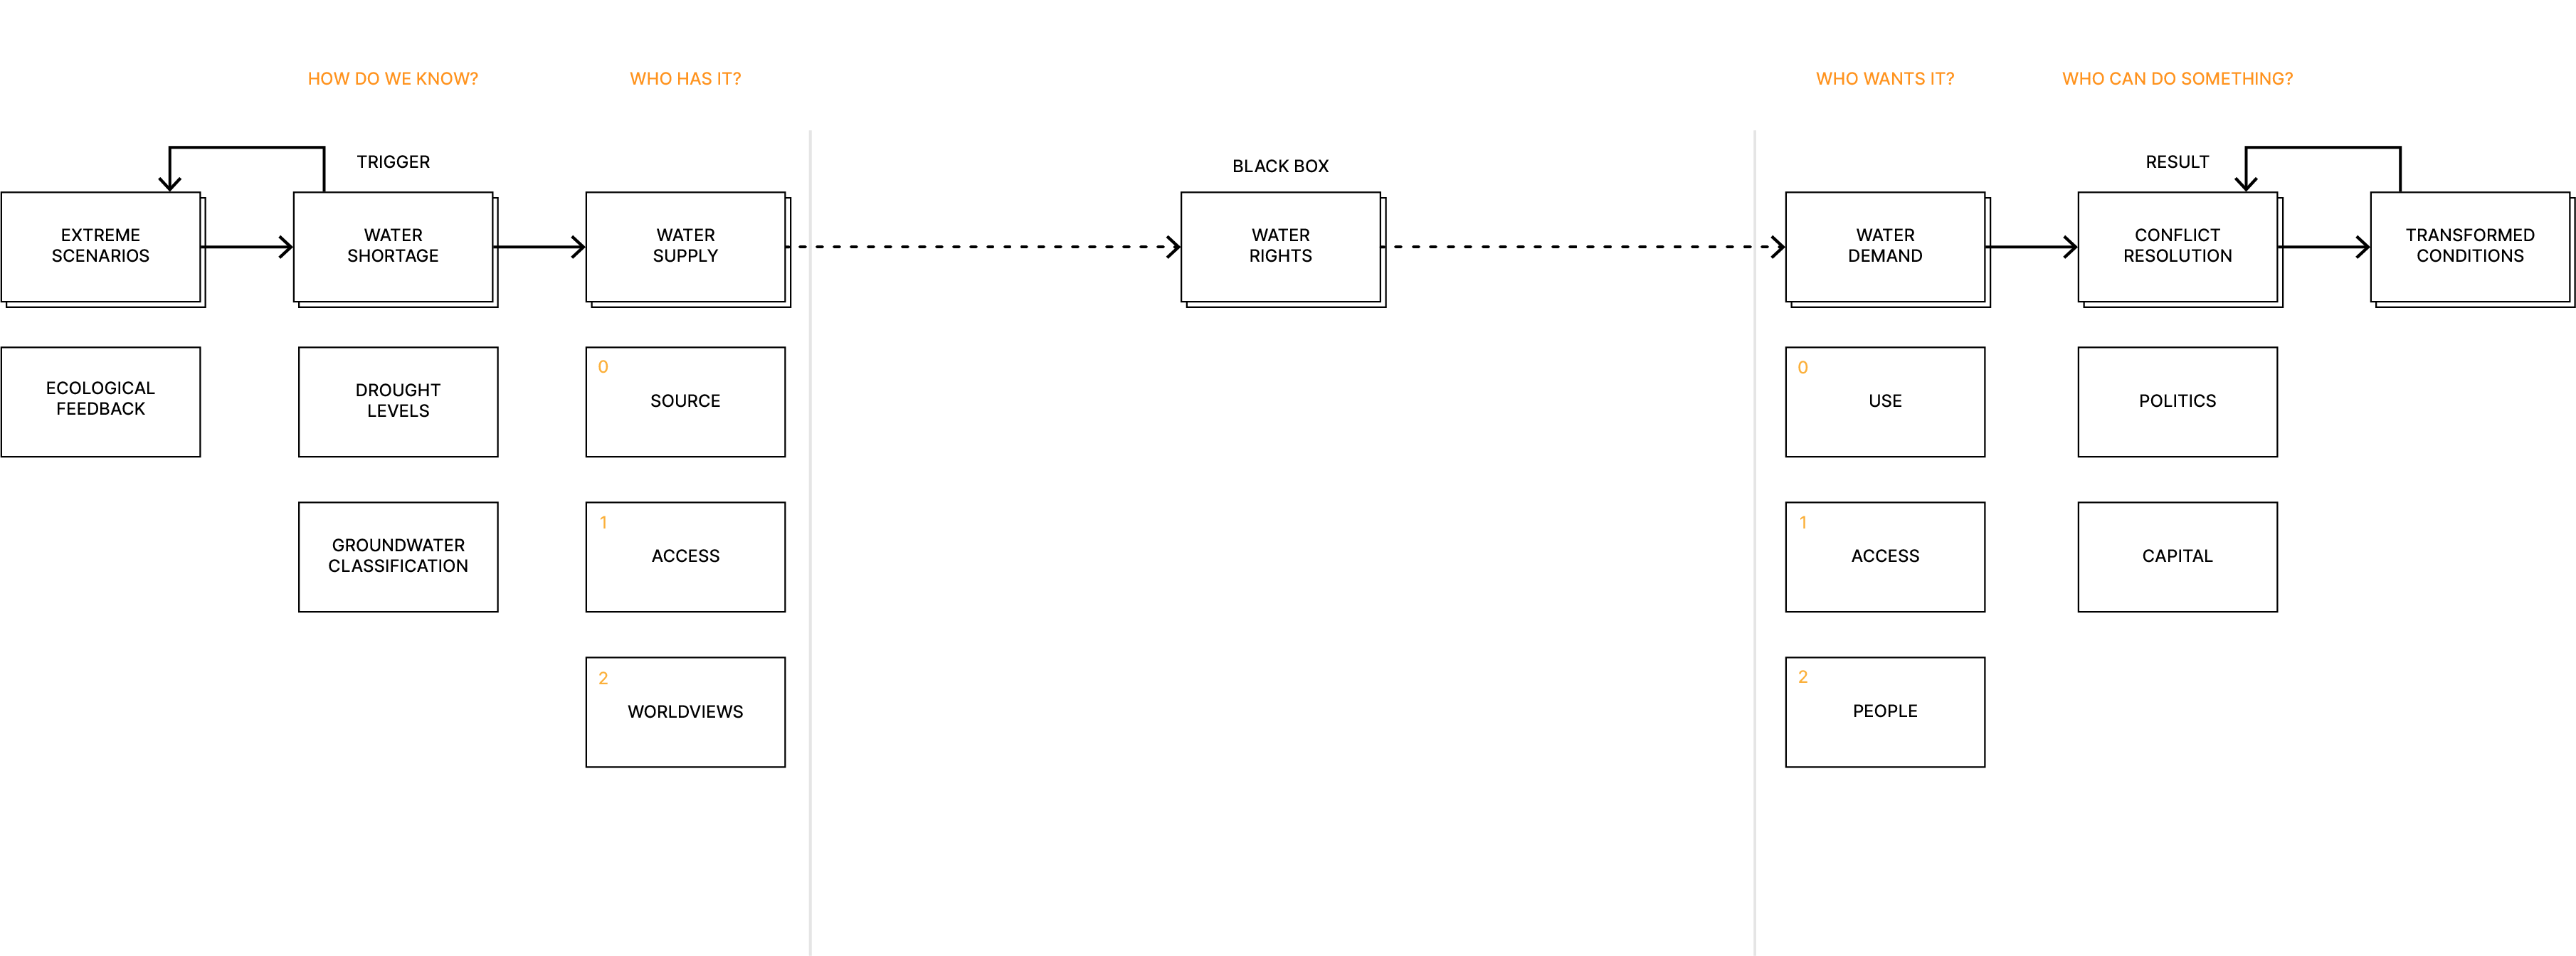
Water Rights Blackbox
Major concepts and research questions / areas in relation to water rights were identified for further research to unpack the blackbox of decision-making around water rights.
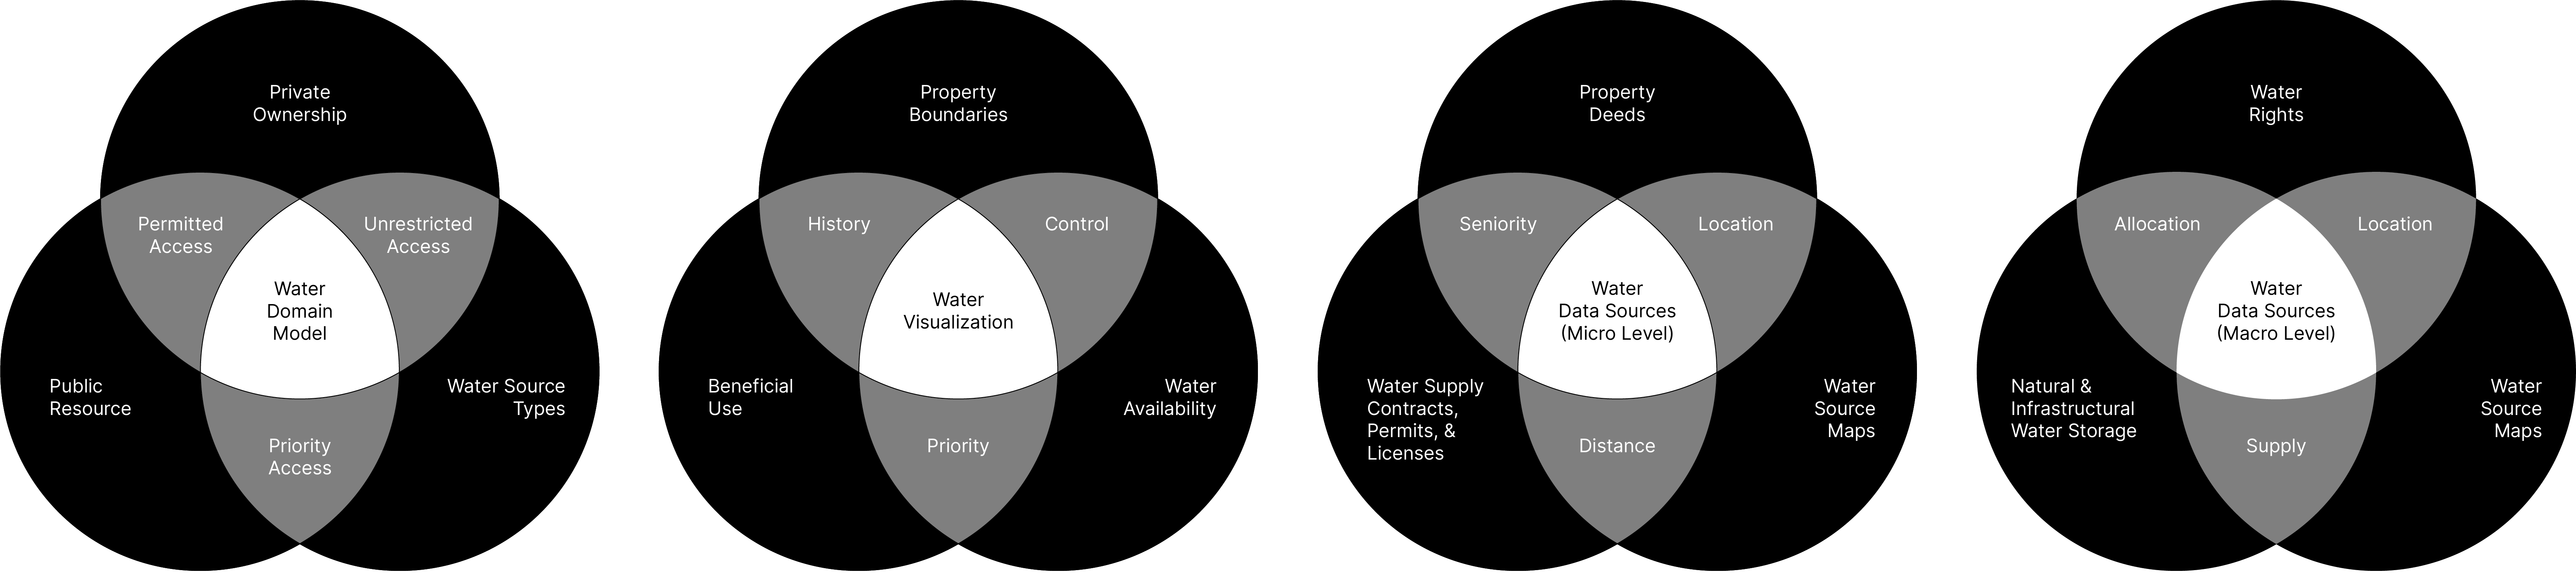
Domain Concepts
The domain concepts were translated into data and structured into areas of visualization. These venn diagrams transformed with each pass of looking at the same concepts through lenses of domain, visualization, and data to translate the domain concepts into data sources in an integrated manner.
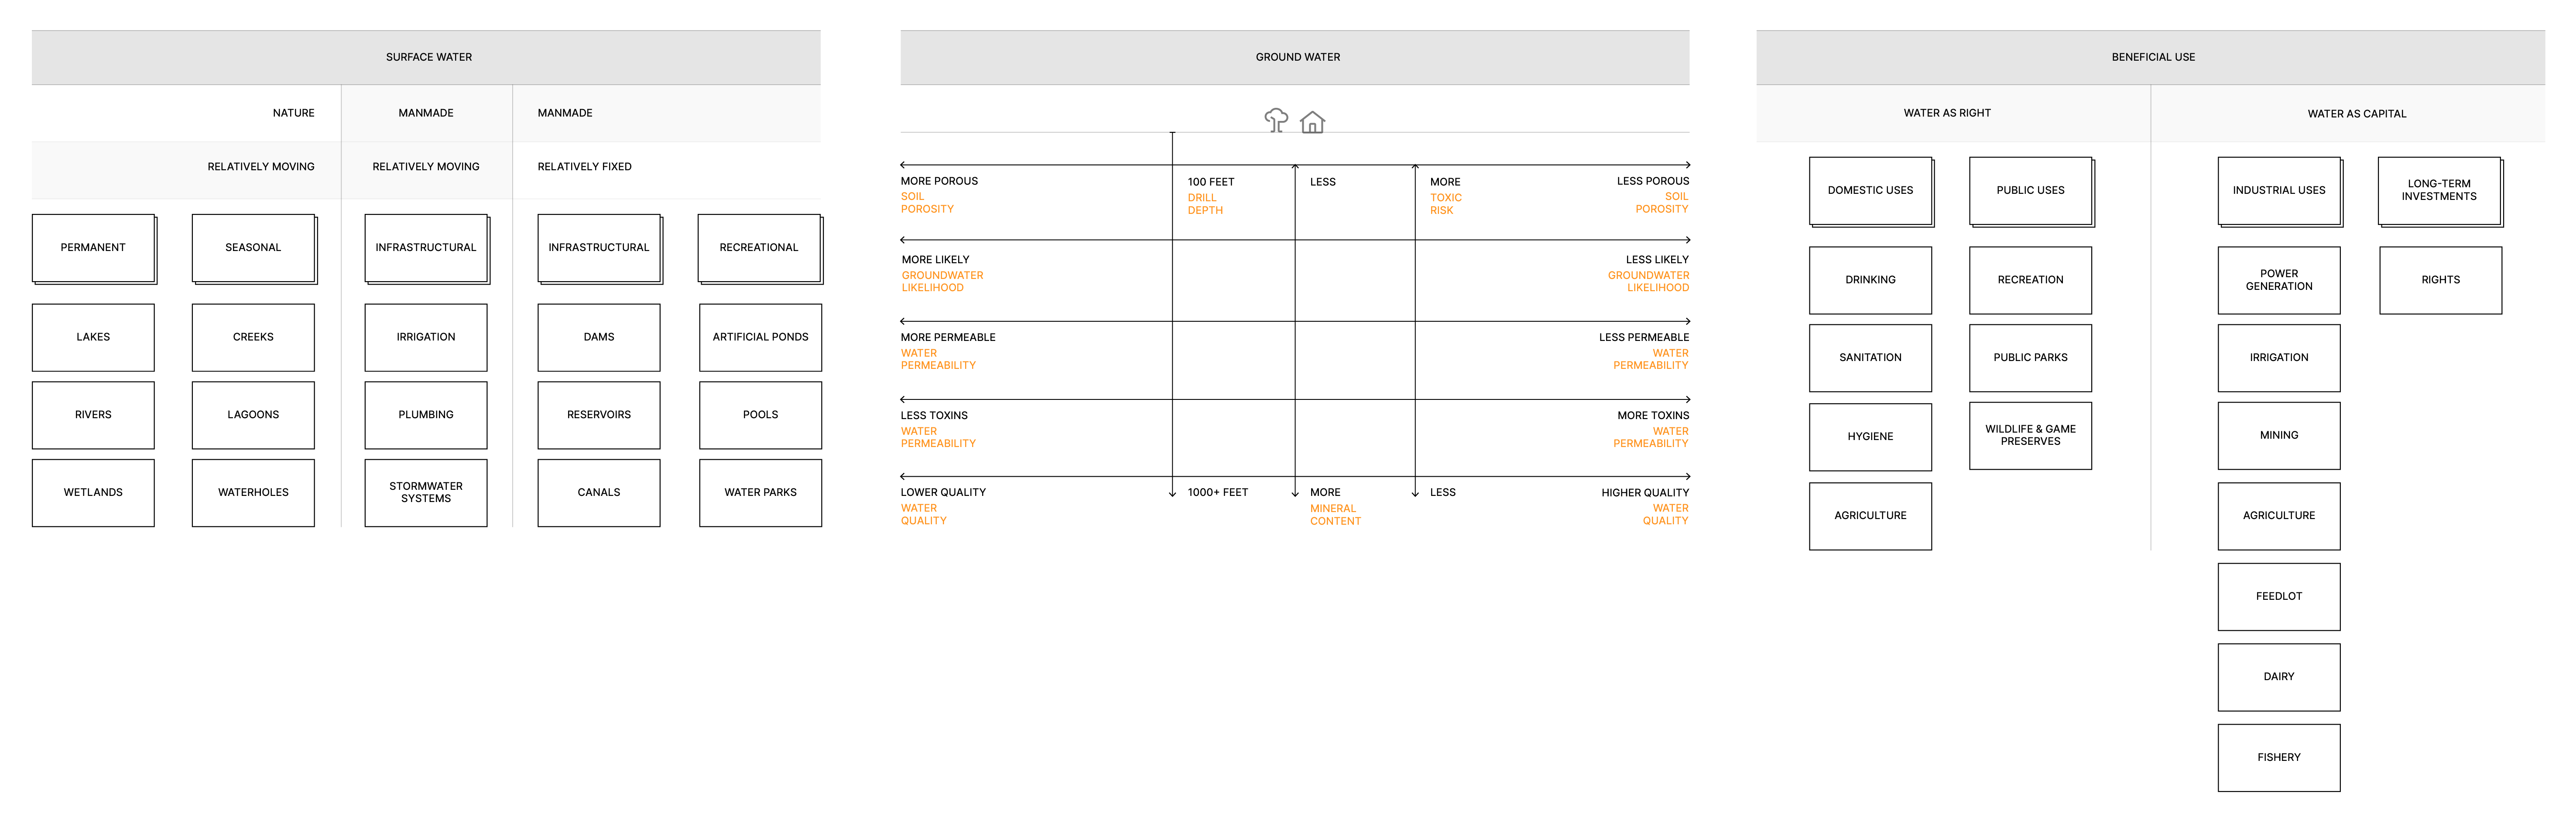
Water Sources
Once data sources were identified, identifying them technically required another pass at decomposition. At this level, the various forms of water were identified and assessed for sourcing feasibility. Dams, reservoirs / lakes, and rivers were identified as the most feasible due to public availability.
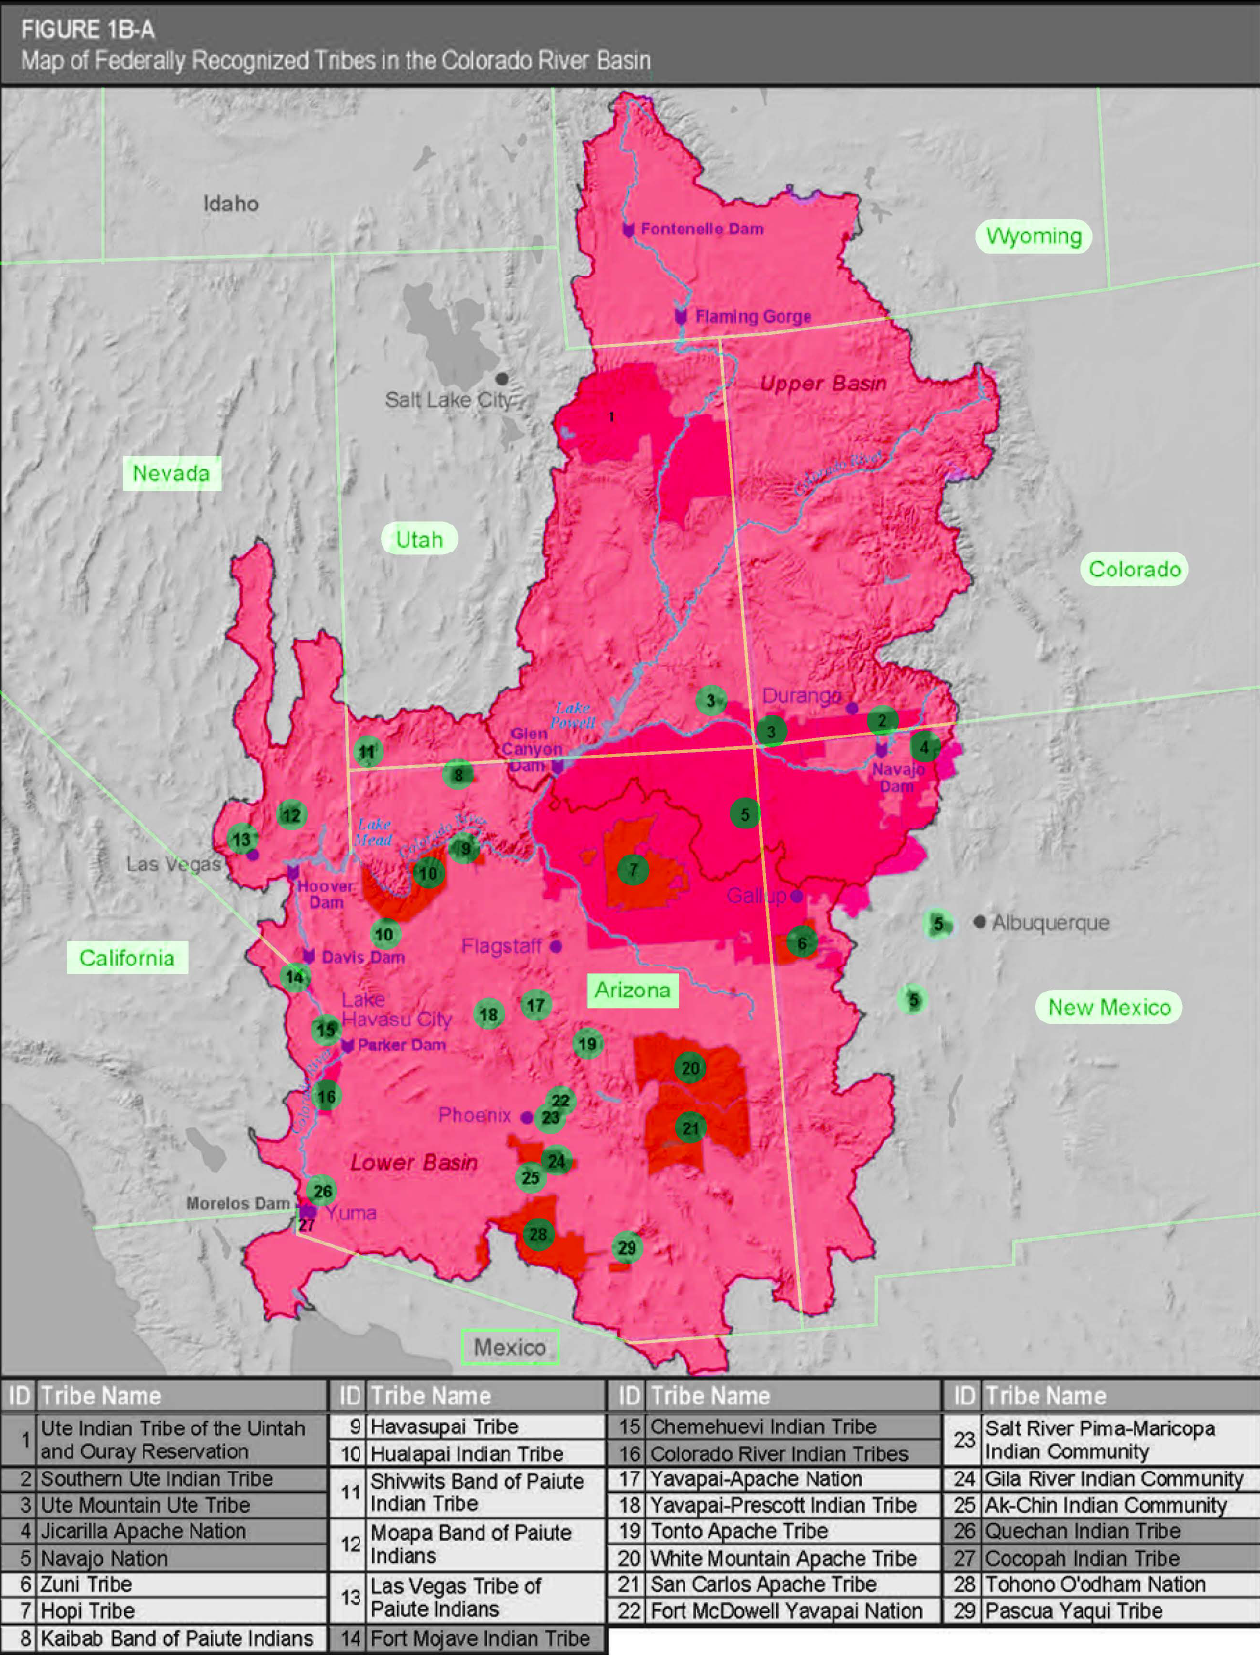
Cultural Analysis
Conflicts around water center around social questions of culture as much as they center around technical questions of resource management. The ways that water has been managed represents a particular worldview. These different cultural lenses needed to be accounted for. In the case of water, the boundaries of indigenous tribes and how they intersect with federal and state geographies was brought in to represent the needs of different stakeholders. Conversations were had early on about the inclusion of all stakeholders.
02System Analysis
02
02System Analysis
System Modeling
The process of visualization served to integrate and surface additional concepts and gaps. The goal was not to duplicate the domain model in representational form but to focus on understanding the relational dynamics and flows between concepts that would otherwise pose a cognitive burden textually and diagrammatically.
In other words, these visualizations were a first pass at understanding how things moved.
In other words, these visualizations were a first pass at understanding how things moved.
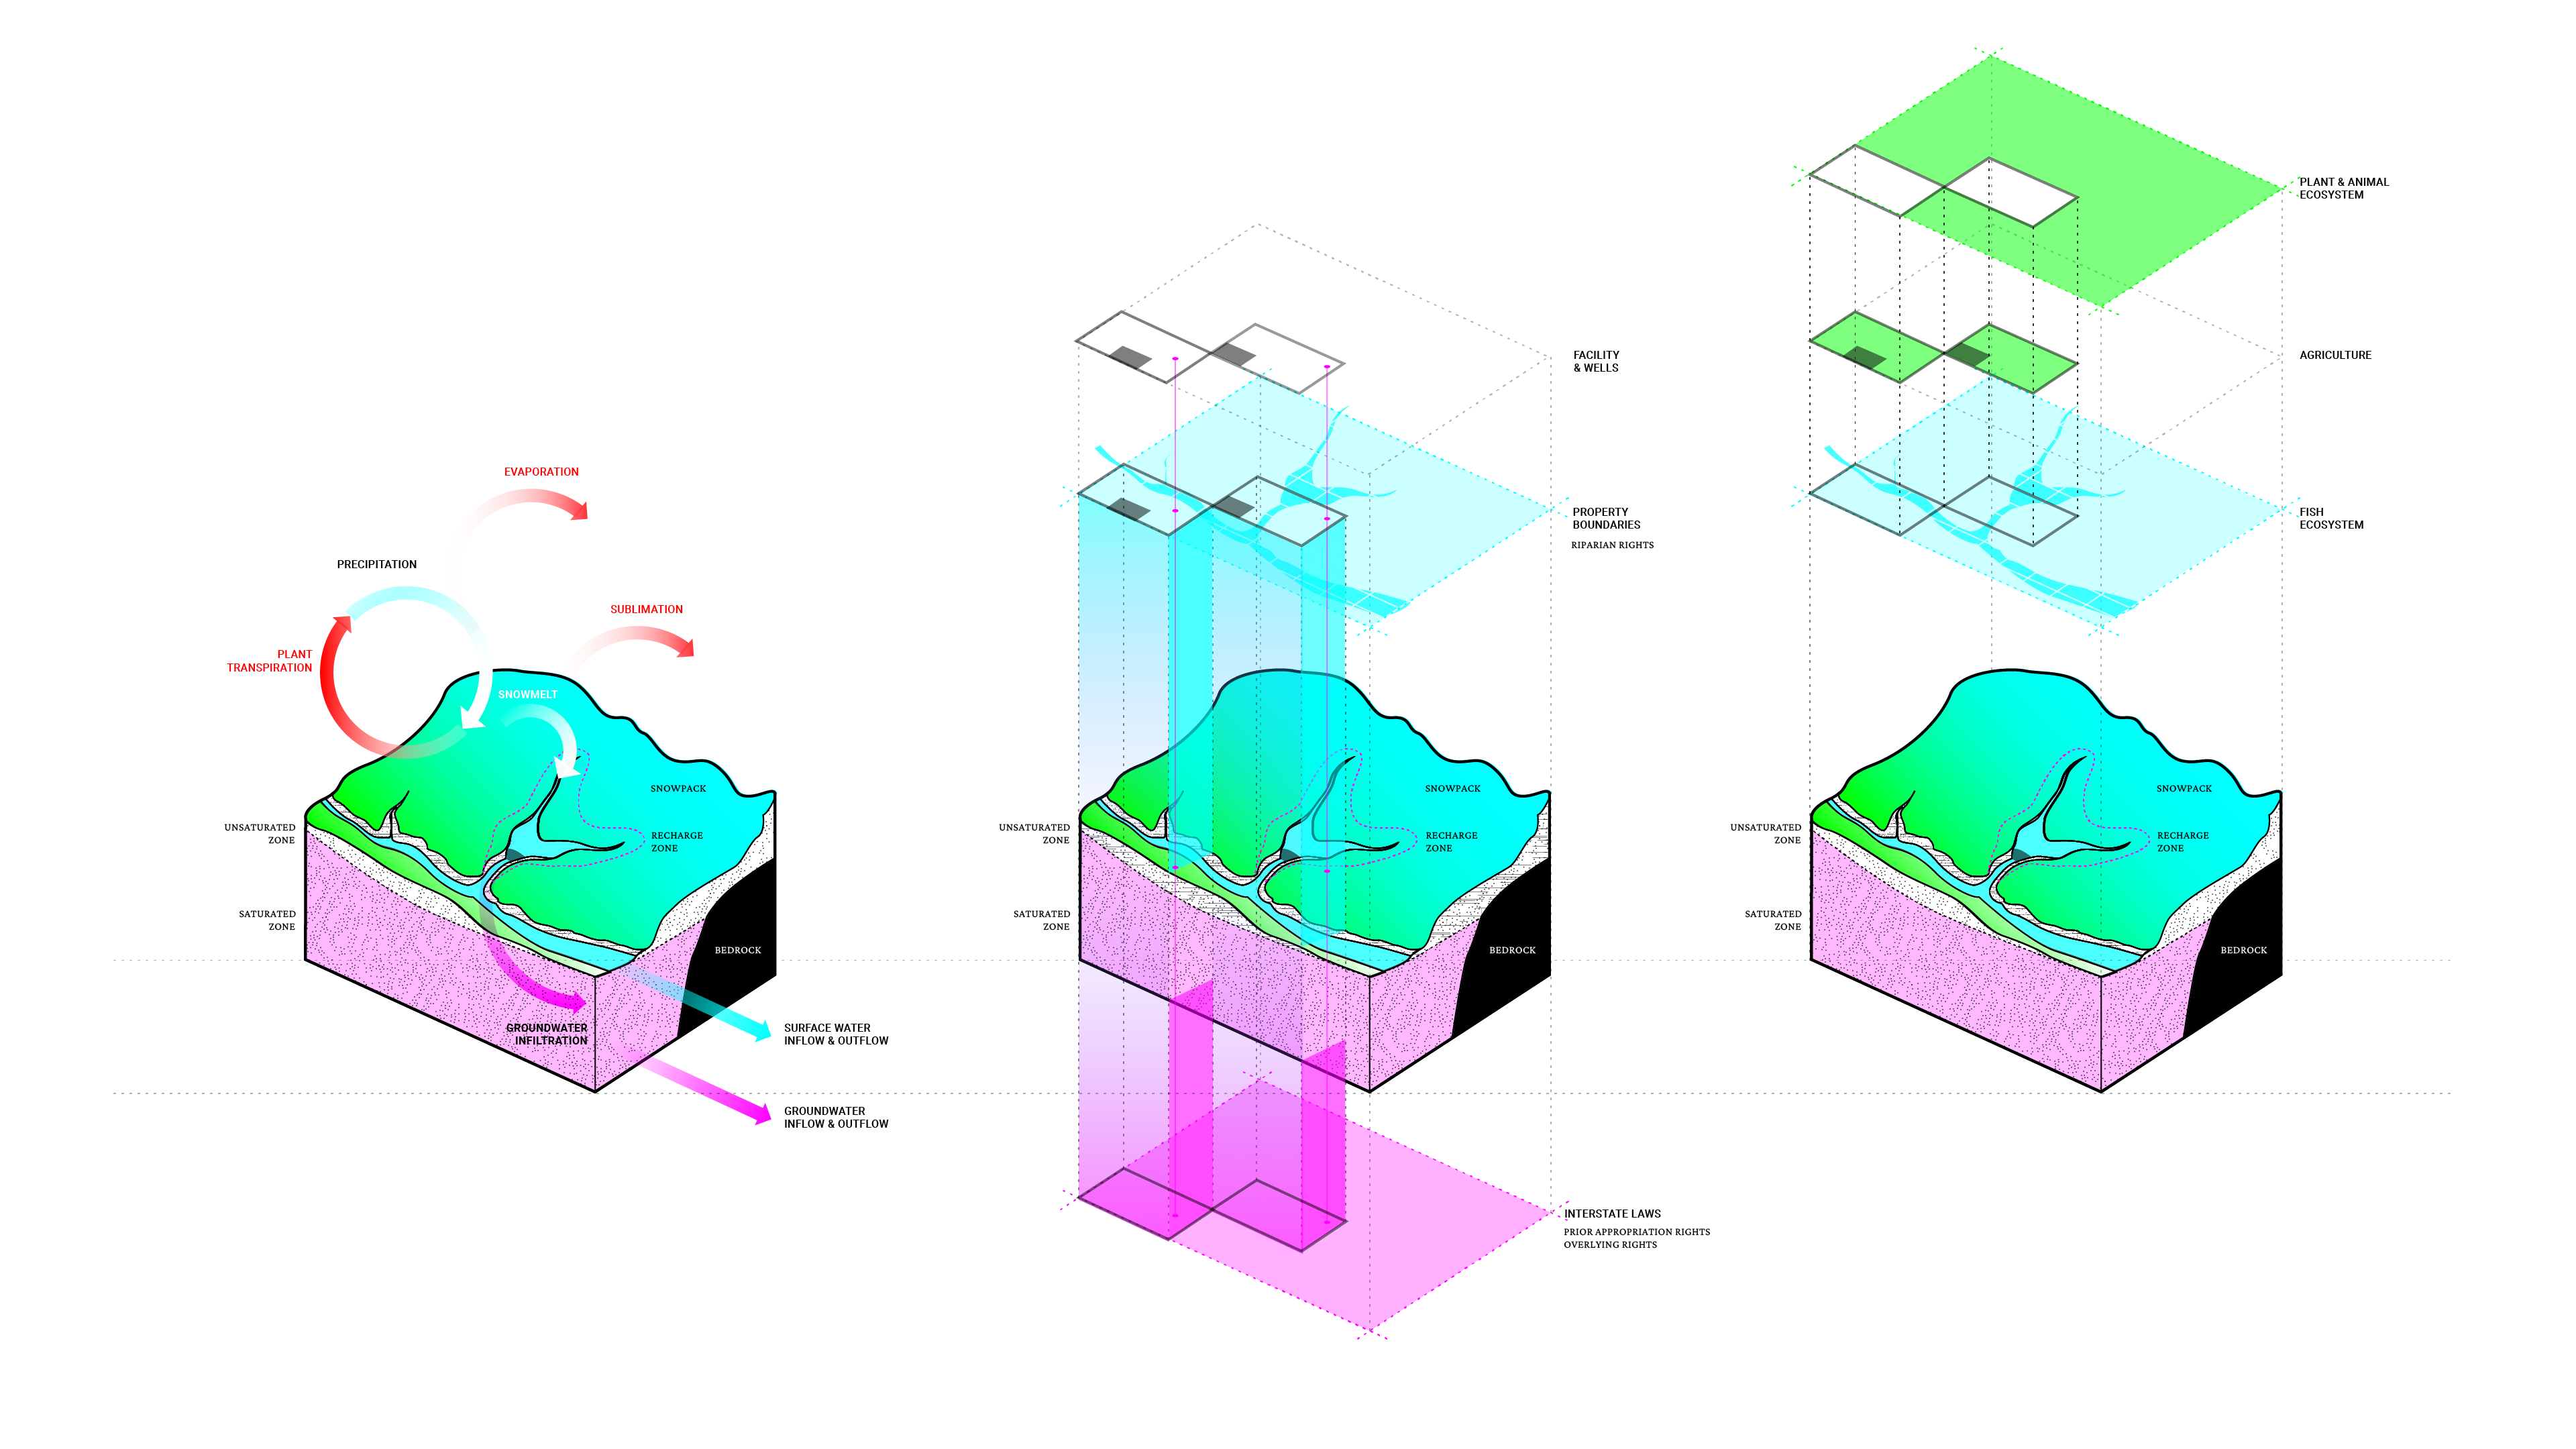
Water Cycle Visualization
Water was traced throughout the natural and infrastructural water cycles to develop a system model of the primary object.
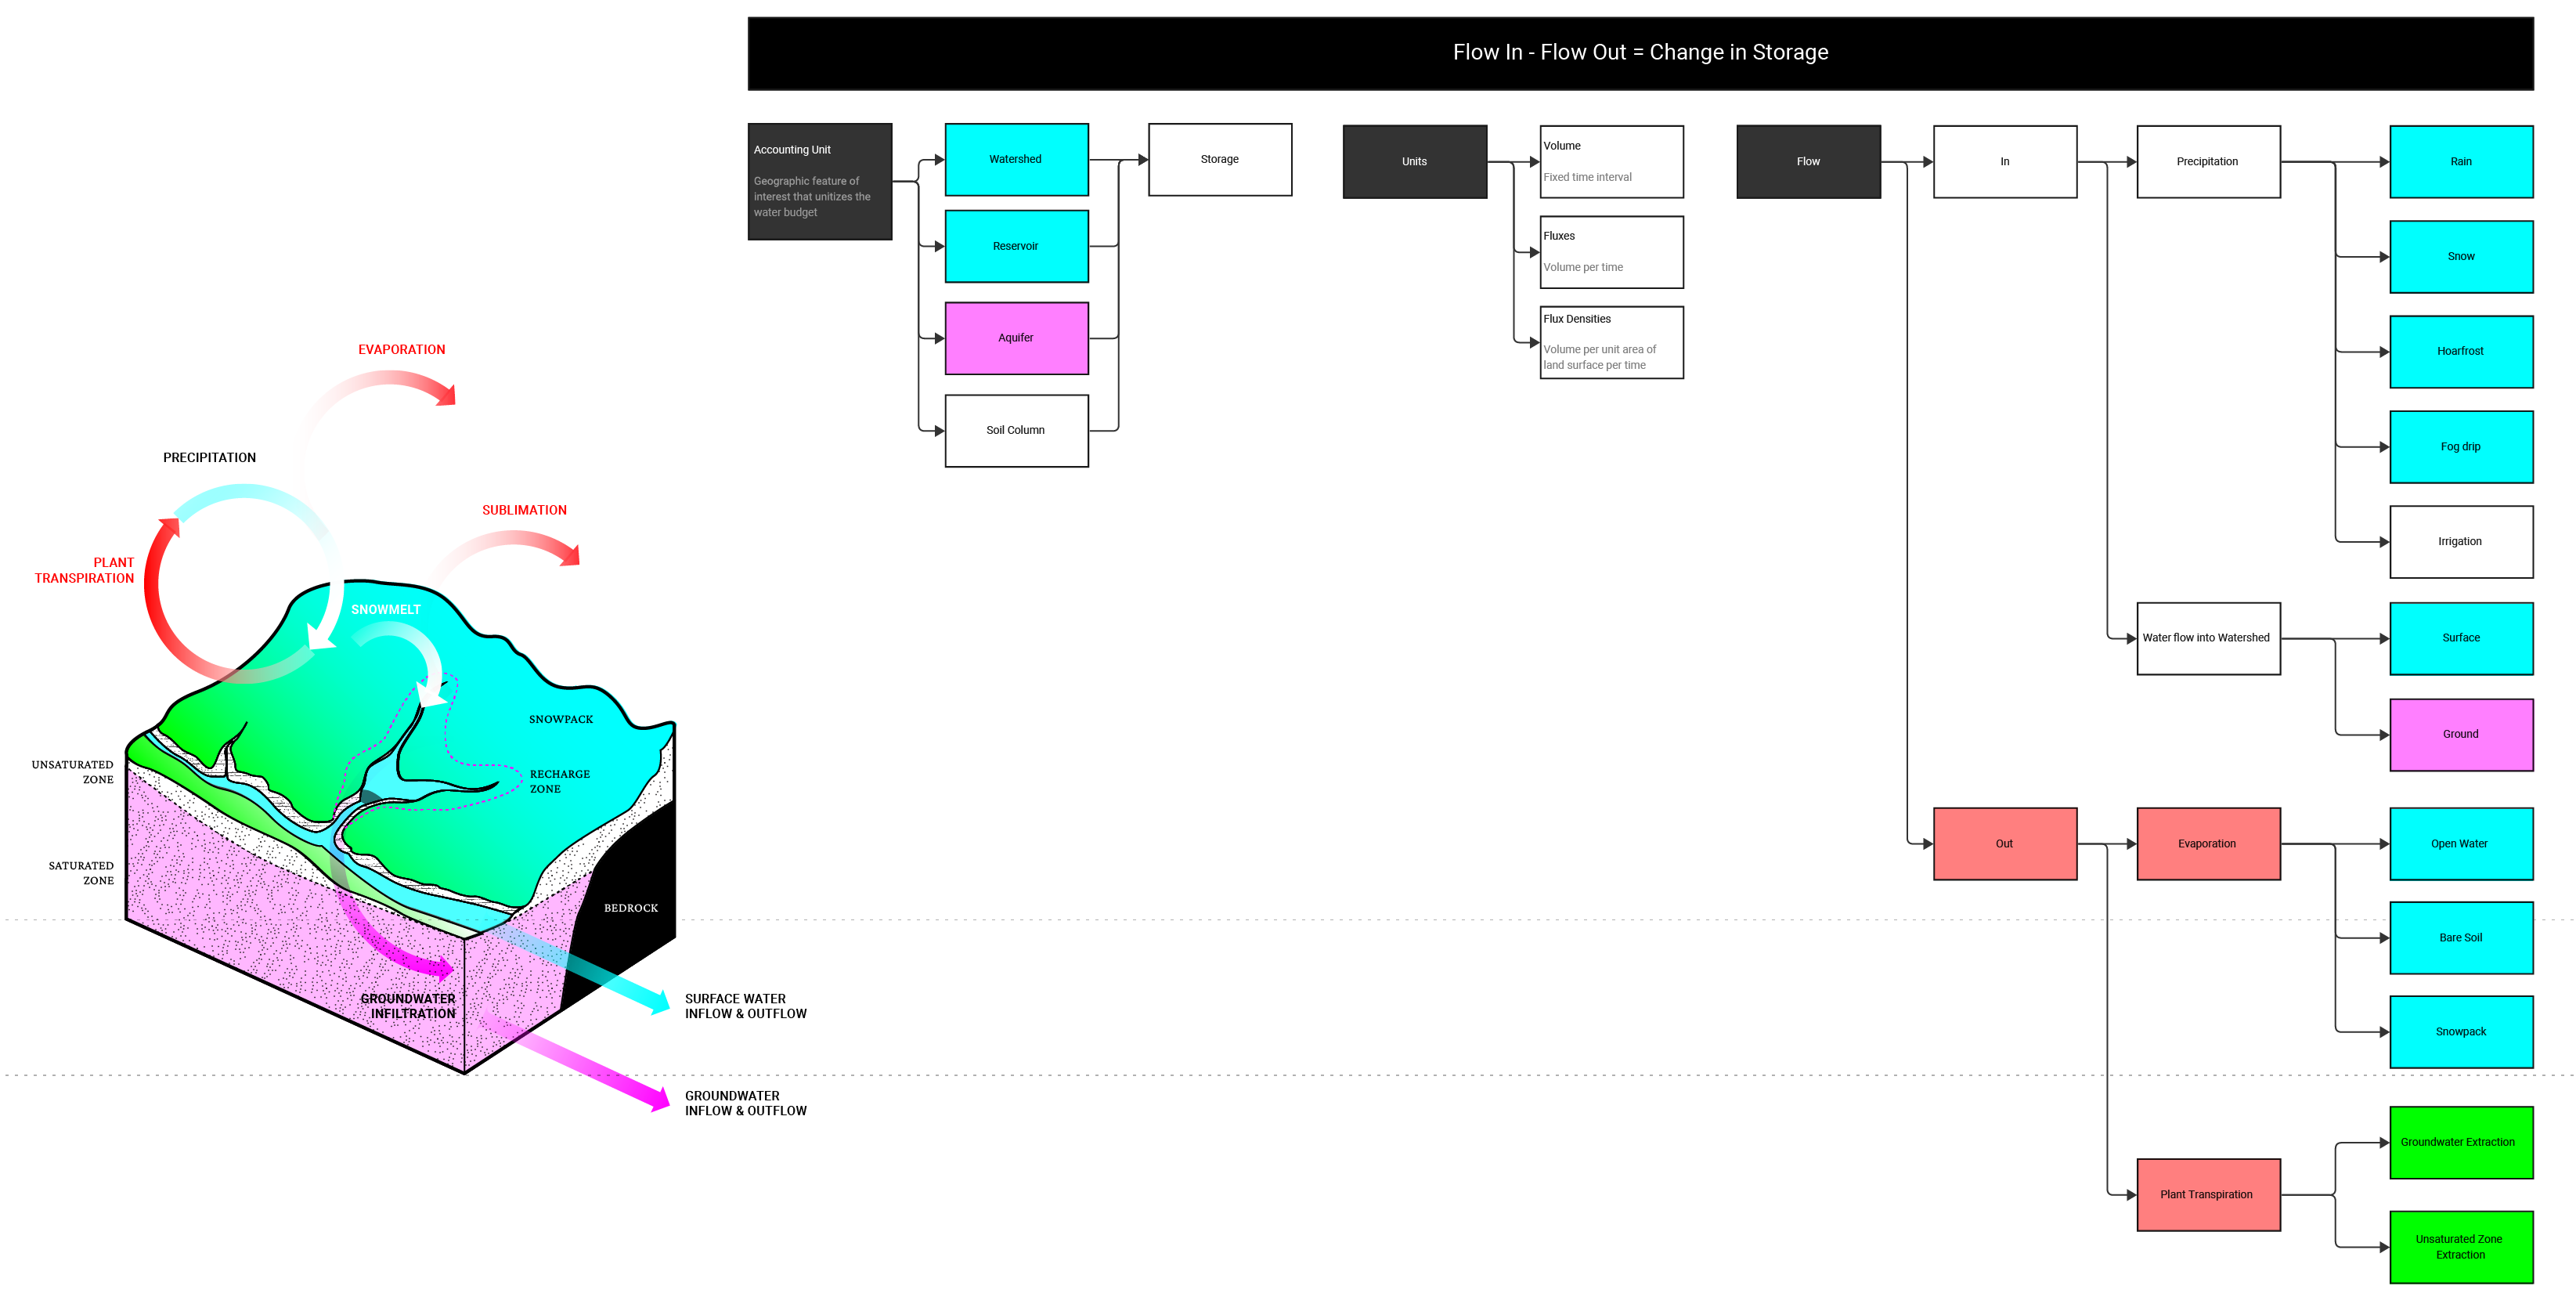
Algorithm Development
A quantification of drought was developed around water budgeting. Borrowed from hydrologists interested in natural systems, and retooled, this quantitative model / algorithm was retooled for actual water availabilities collected from sensors. The formula served as the seed for functionally reducing the data space upon which a broader cultural interpretation of water could be developed.
03System Modeling
03
03System Modeling
Semi-Structured Interviews
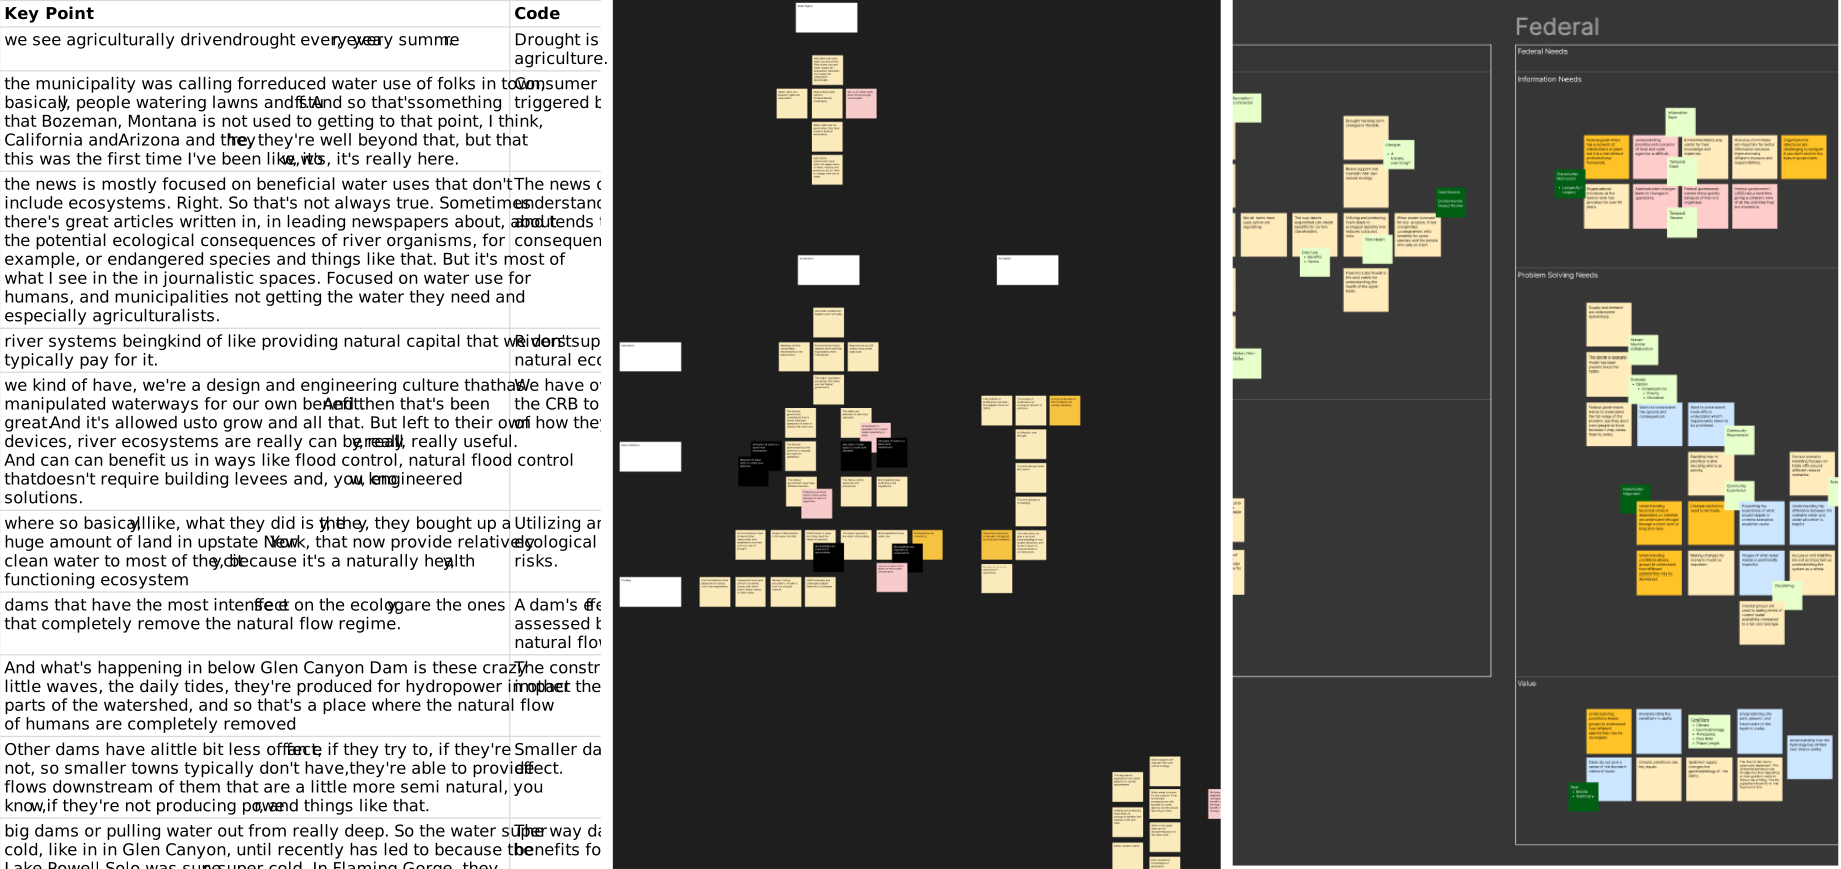
Four stakeholders -- a river ecologist, a superlawyer representing farmers, a geohydrologist, a water economist, a director of water resources, and a drought science advisor working for the Bureau of Reclamation -- were interviewed for their domain expertise and for concept validation.
04Concept Validation
04
04Concept Validation
Conceptual Design
Three concepts were dynamically prototyped to flesh out conceptual directions with the client and test data availability. Since our client was a non-profit that had little experience with digital technology, I had to design our prototypes to carefully facilitate conversations in order to elicit requirements and minimize distractions while maintaining conceptual openness. At the same time, our clients were extremely sophisticated architects, so the visual design had to be compelling. Basic wireframing for rapid prototyping would be insufficient to guiding the conversation considering the design caliber expected from Certain Measures. Flashy design-forward prototyping would be distracting and present problems for the engineering team downstream as this was expected to be a dense application that would, at the same time, be used by a general audience. The challenge in leading this particular client through the project was balancing client design sophistication, technical requirements elicitation, and user needs at the right level through every phase of the project.
For the first pass during conceptual design phase, color was used intentionally and sparingly with a focus on visualization, data, and information architecture. Rules on common interaction patterns were judiciously broken.
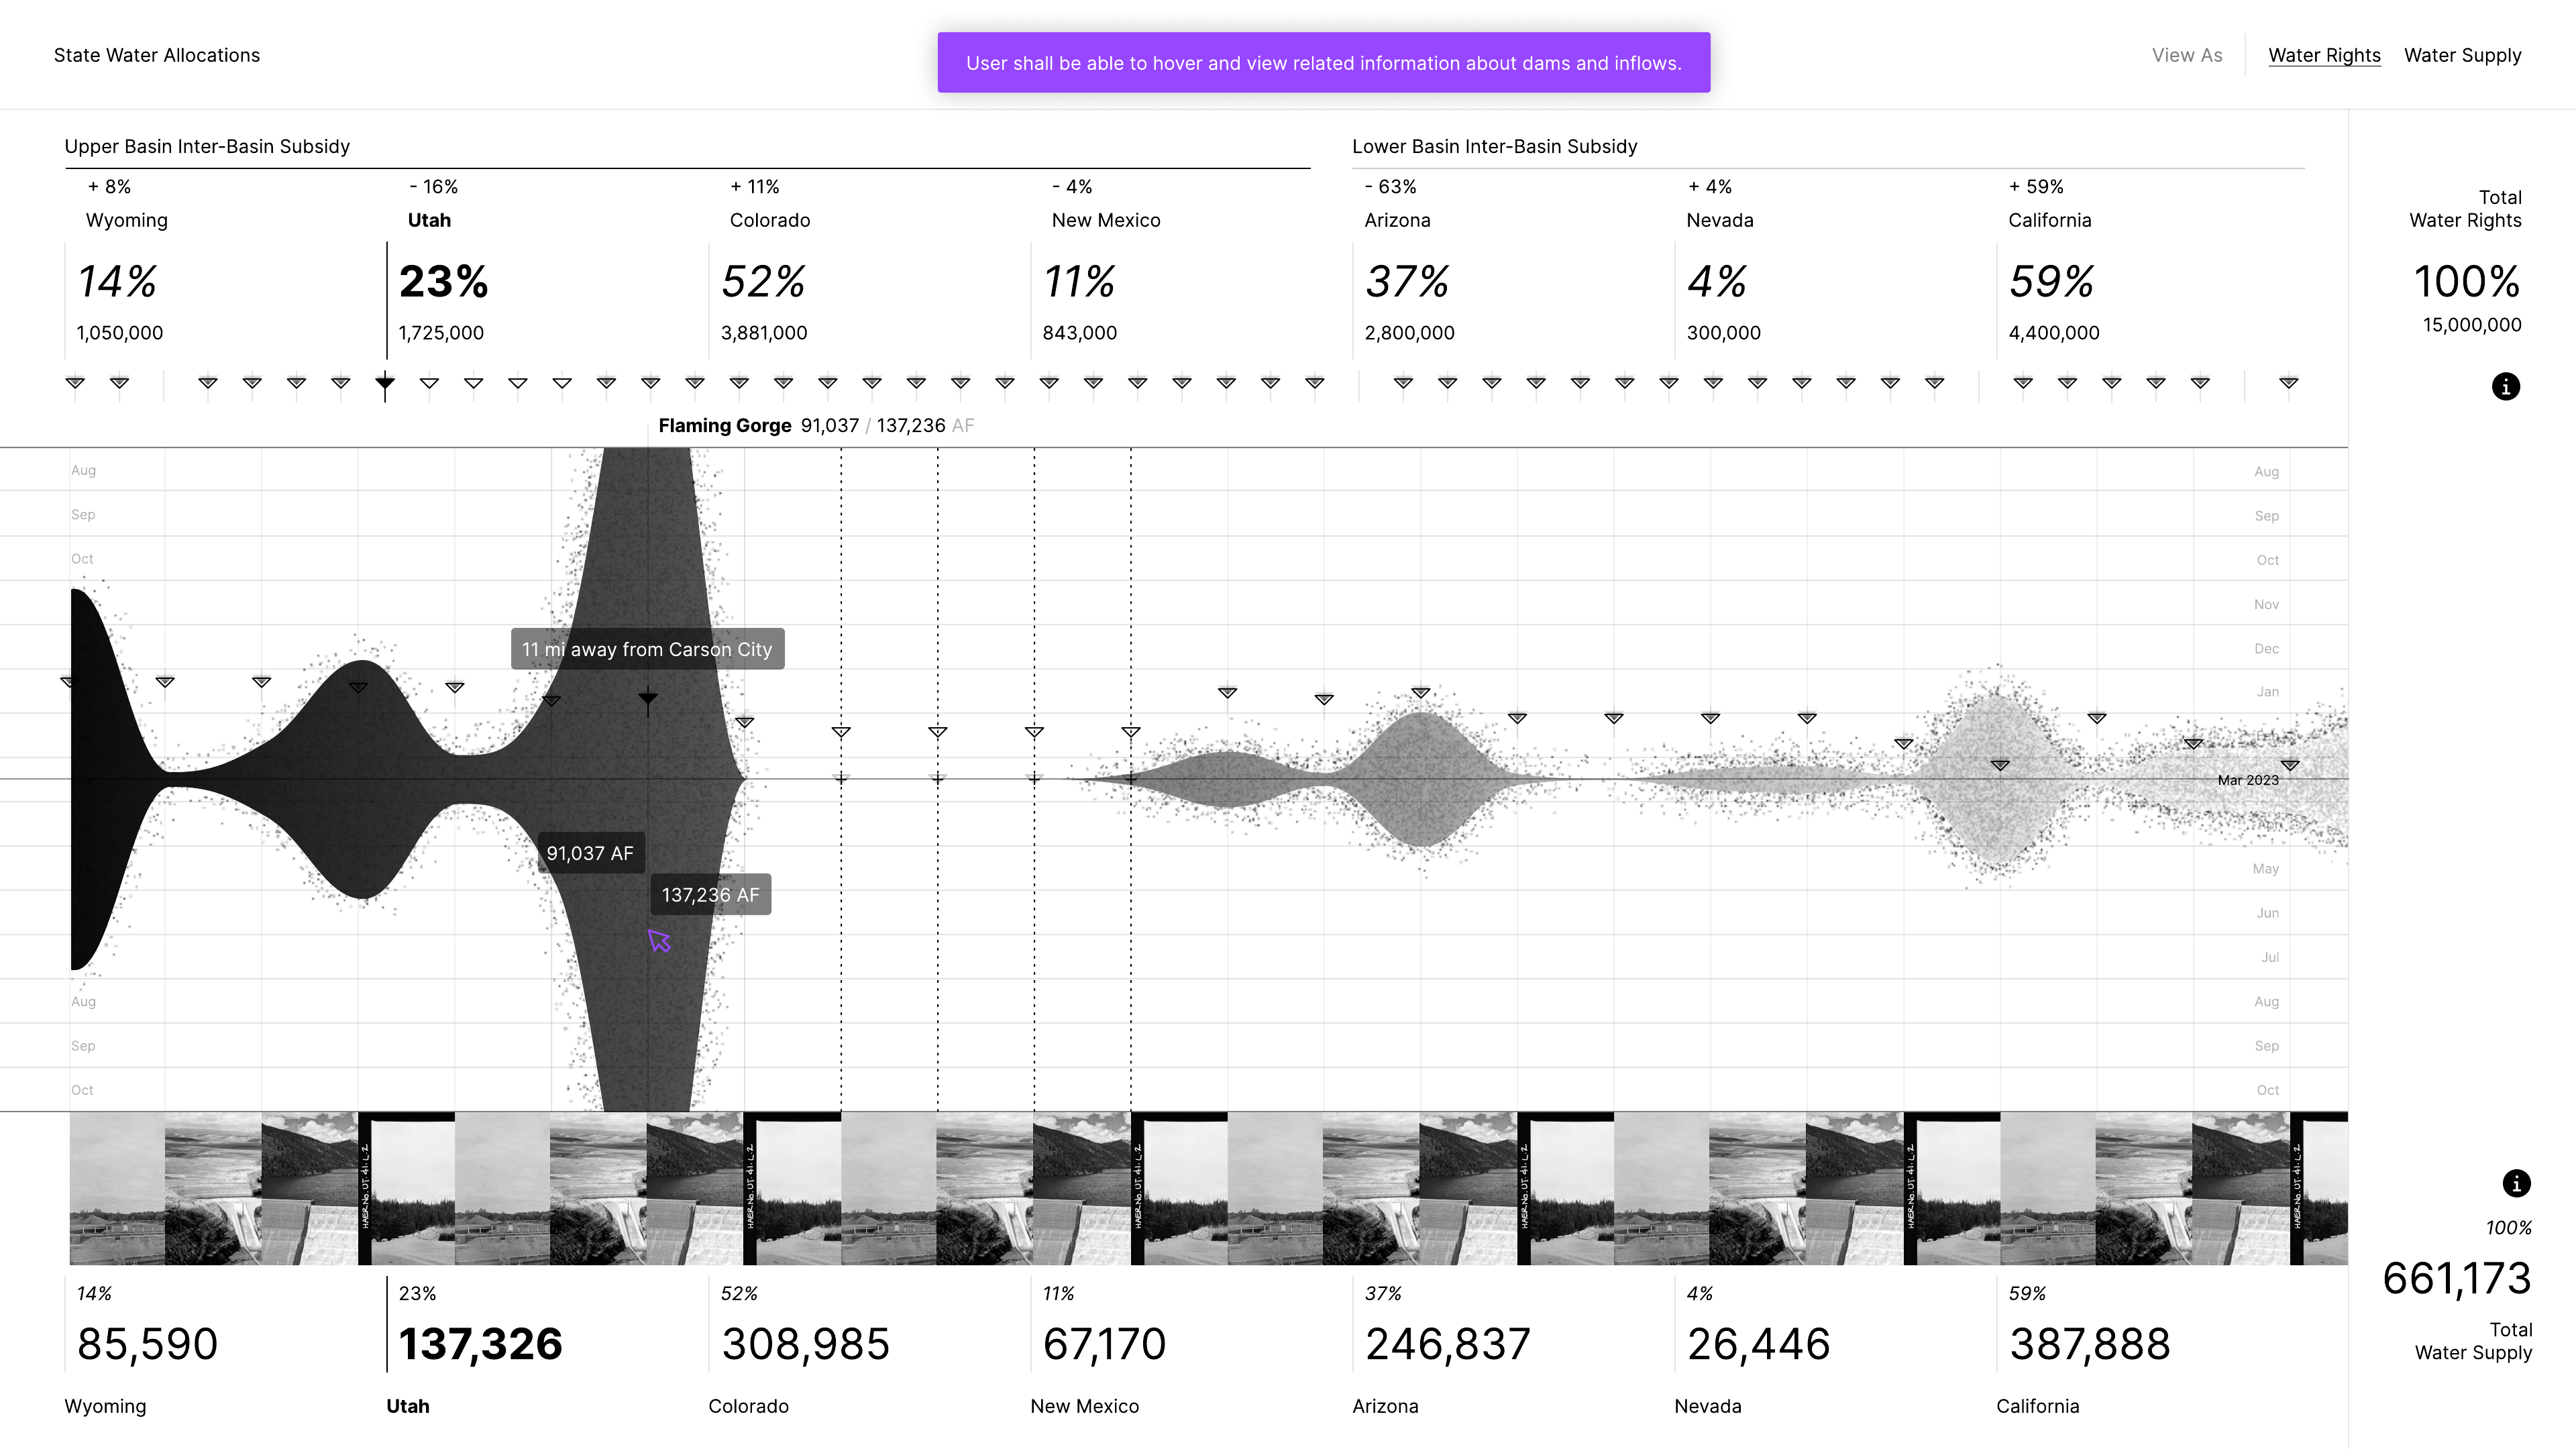
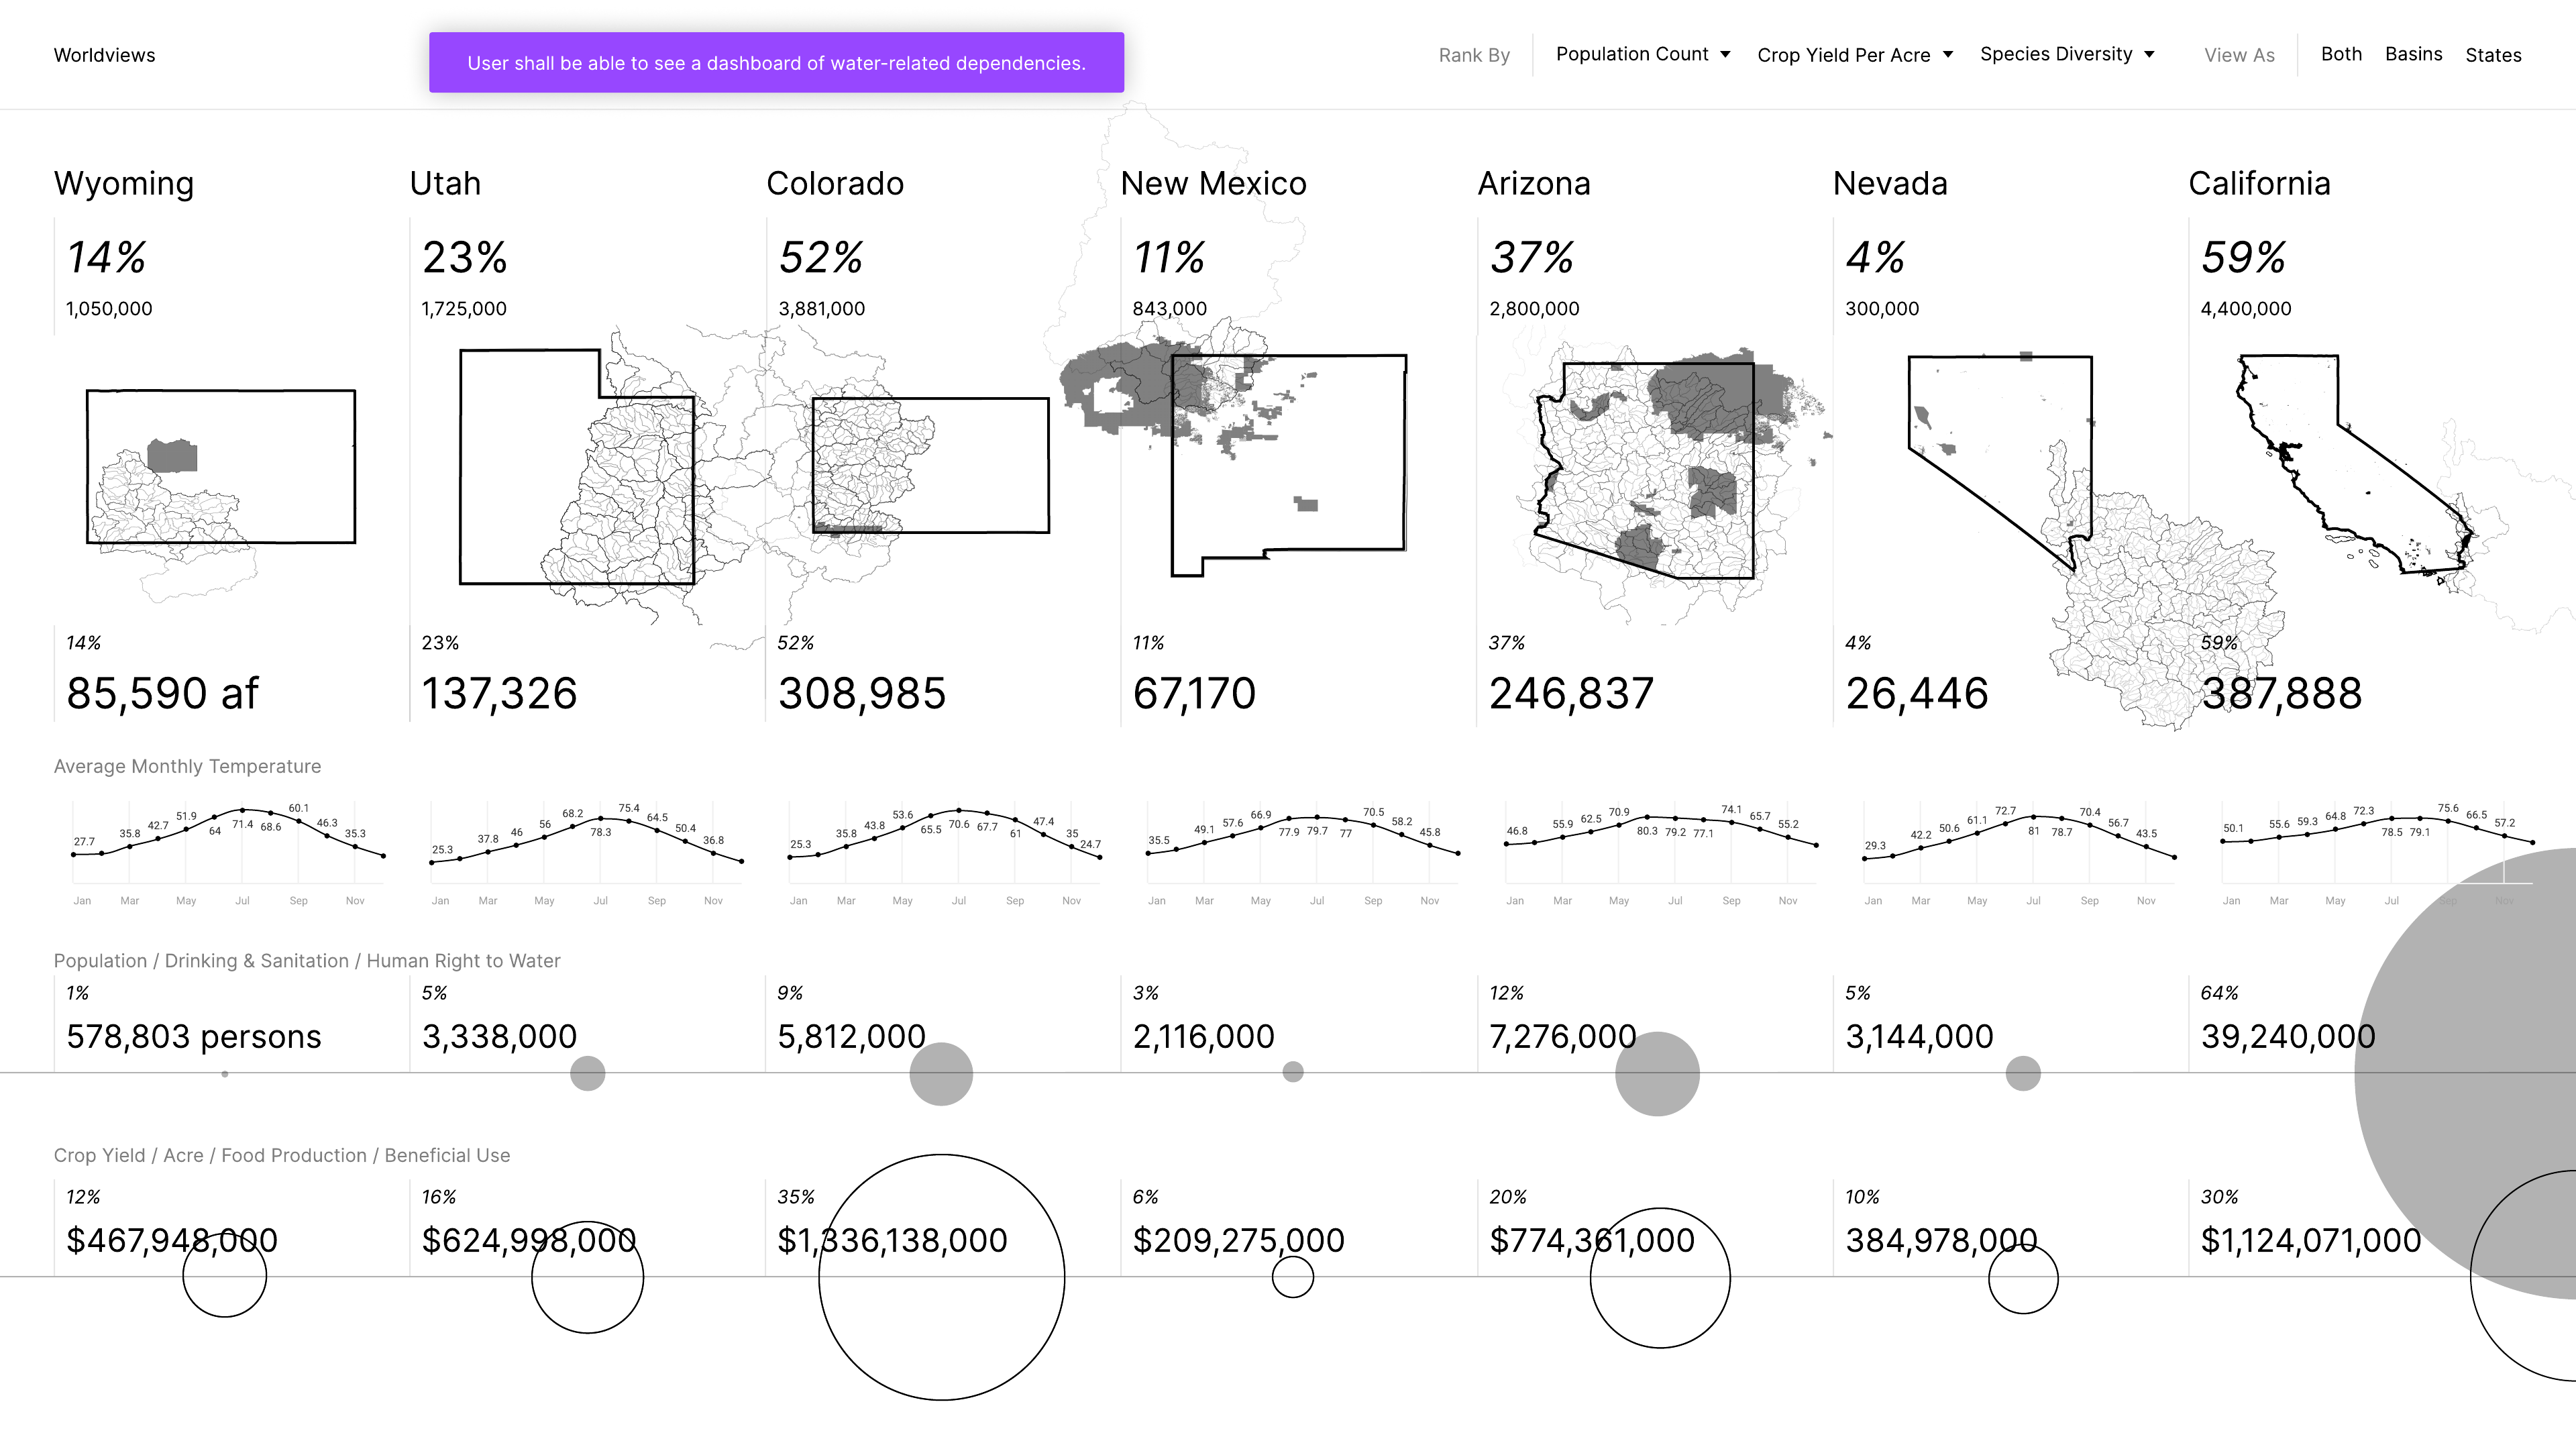
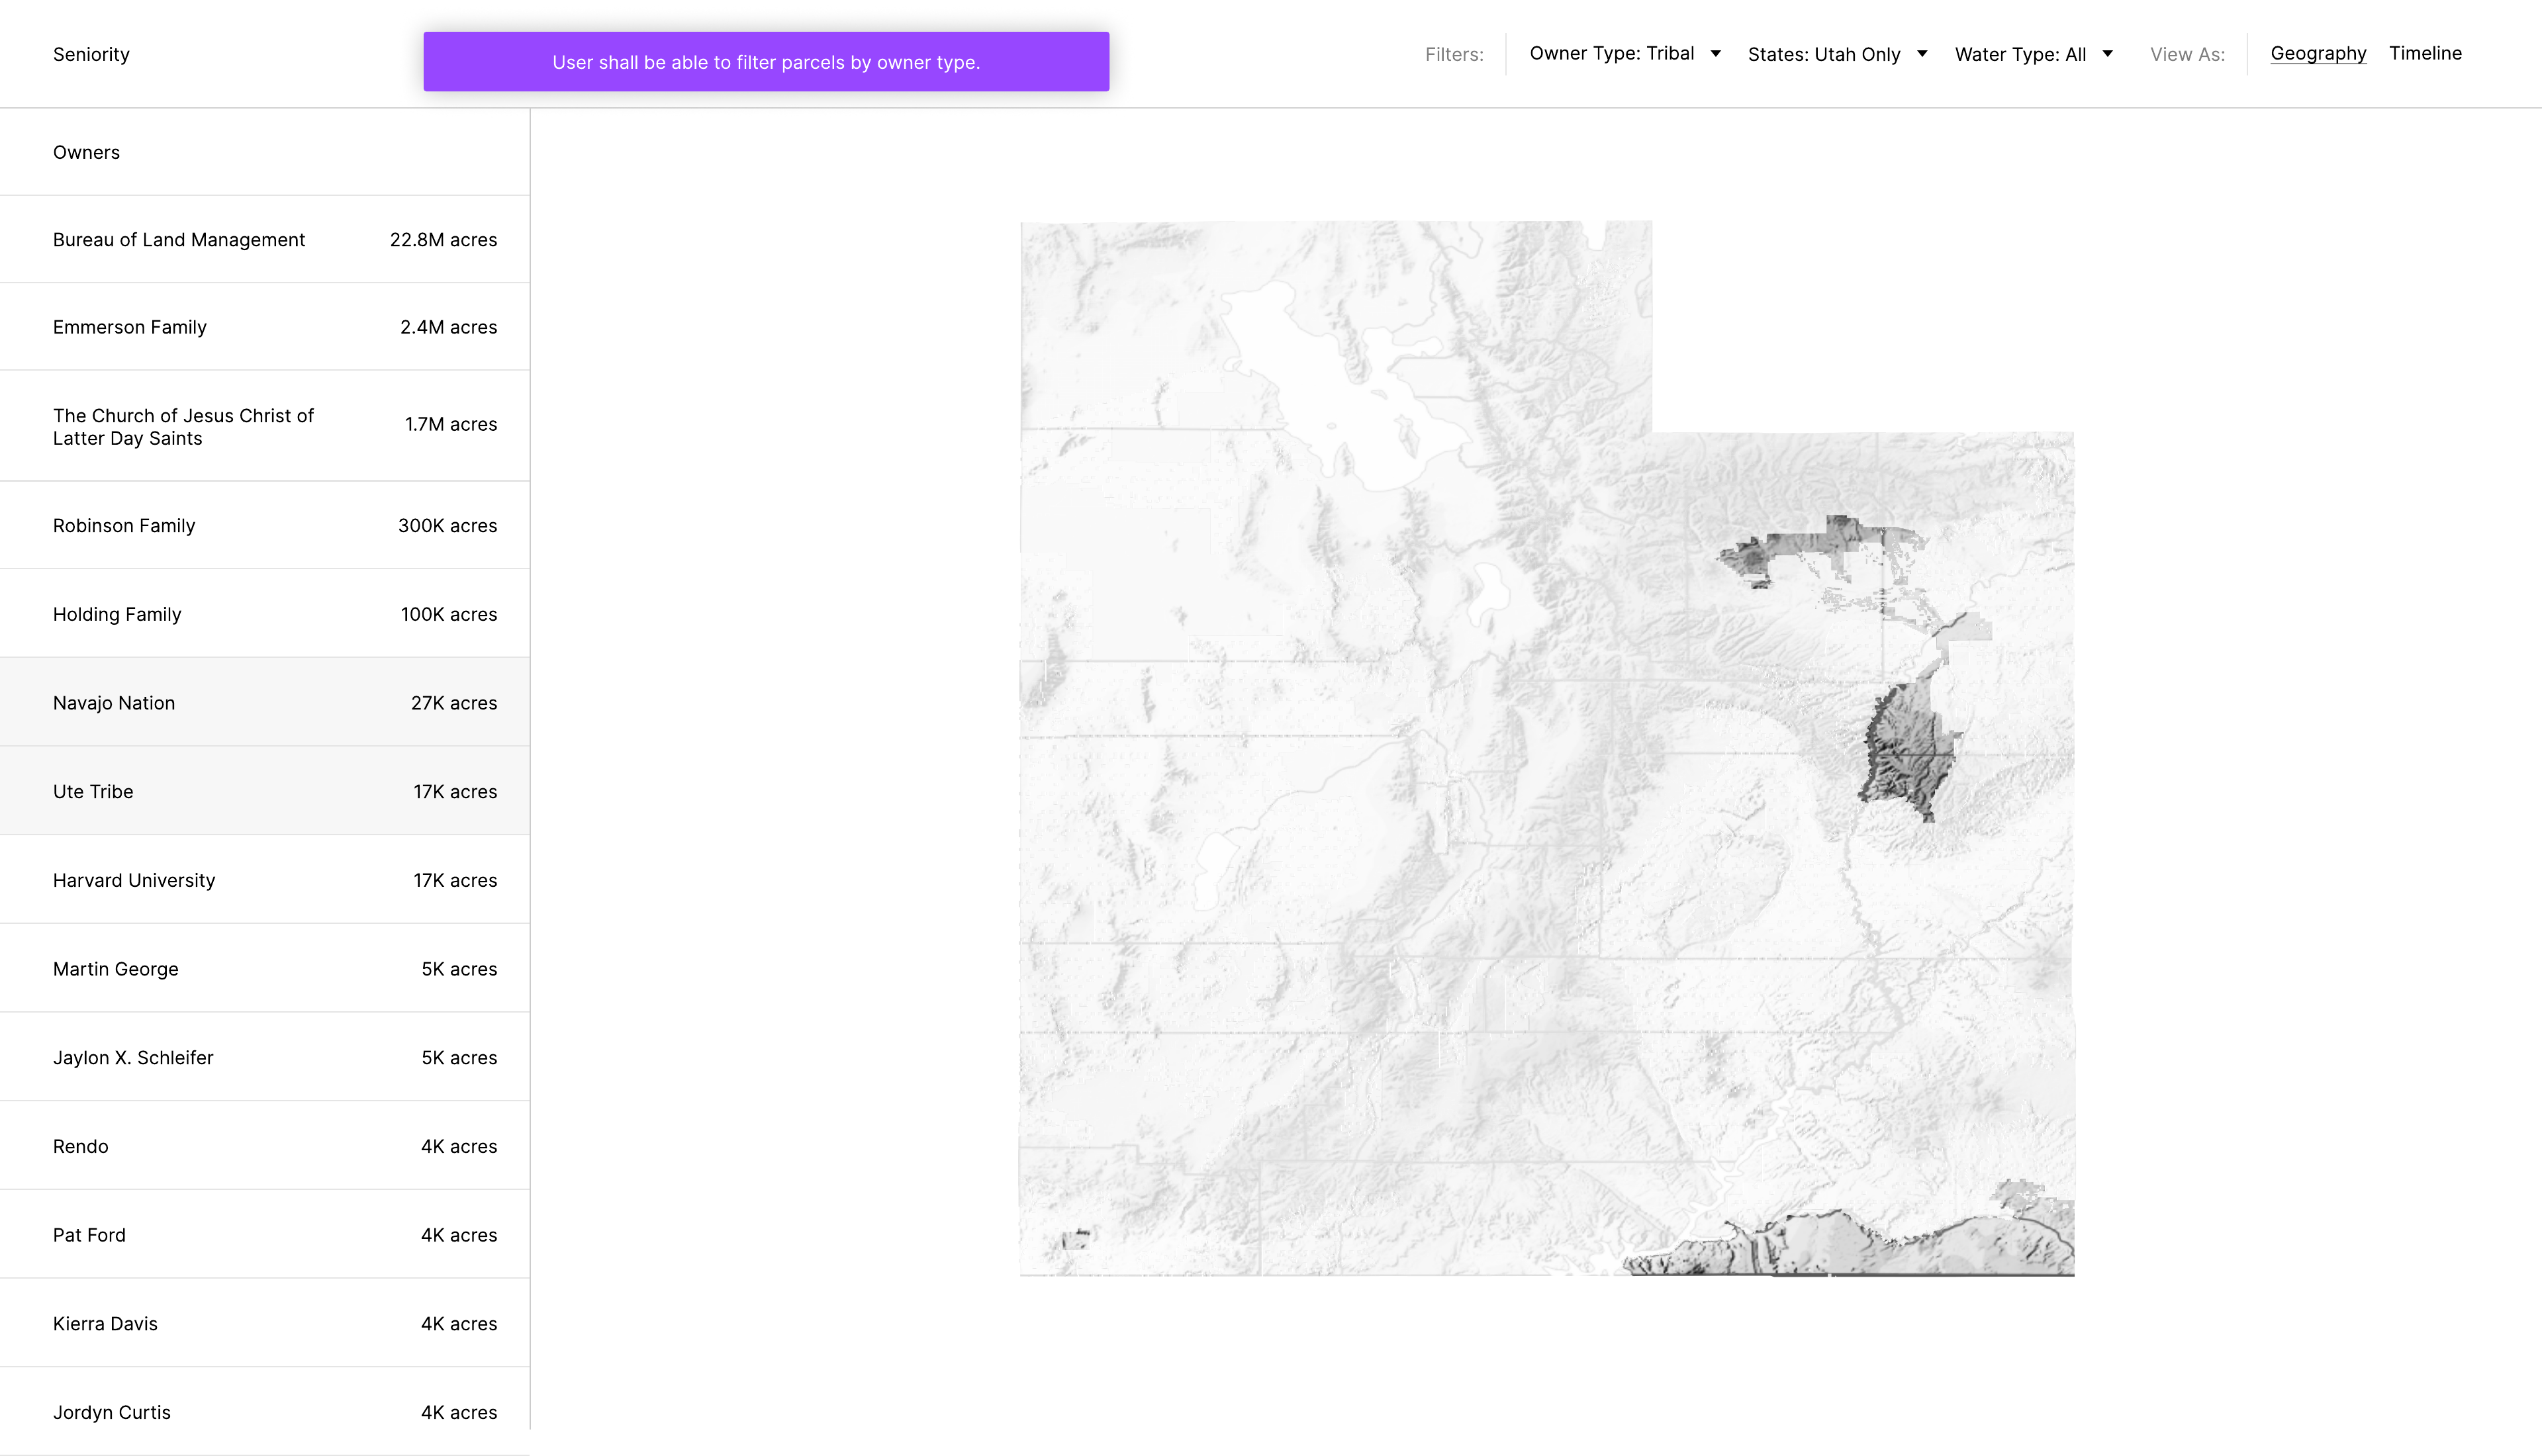
Three concepts extended based on data design research: 1) Water Allocations, 2) Worldviews, and 3) Seniority, each illustrating particular frames around public data available on water.
For the first pass during conceptual design phase, color was used intentionally and sparingly with a focus on visualization, data, and information architecture. Rules on common interaction patterns were judiciously broken.
Three concepts extended based on data design research: 1) Water Allocations, 2) Worldviews, and 3) Seniority, each illustrating particular frames around public data available on water.
Drought / Water Rights / v1
Drought / Stakeholder Lenses / v1
Drought / Property Seniority / v1
05Conceptual Design
05
05Conceptual Design
Streamflow Concept
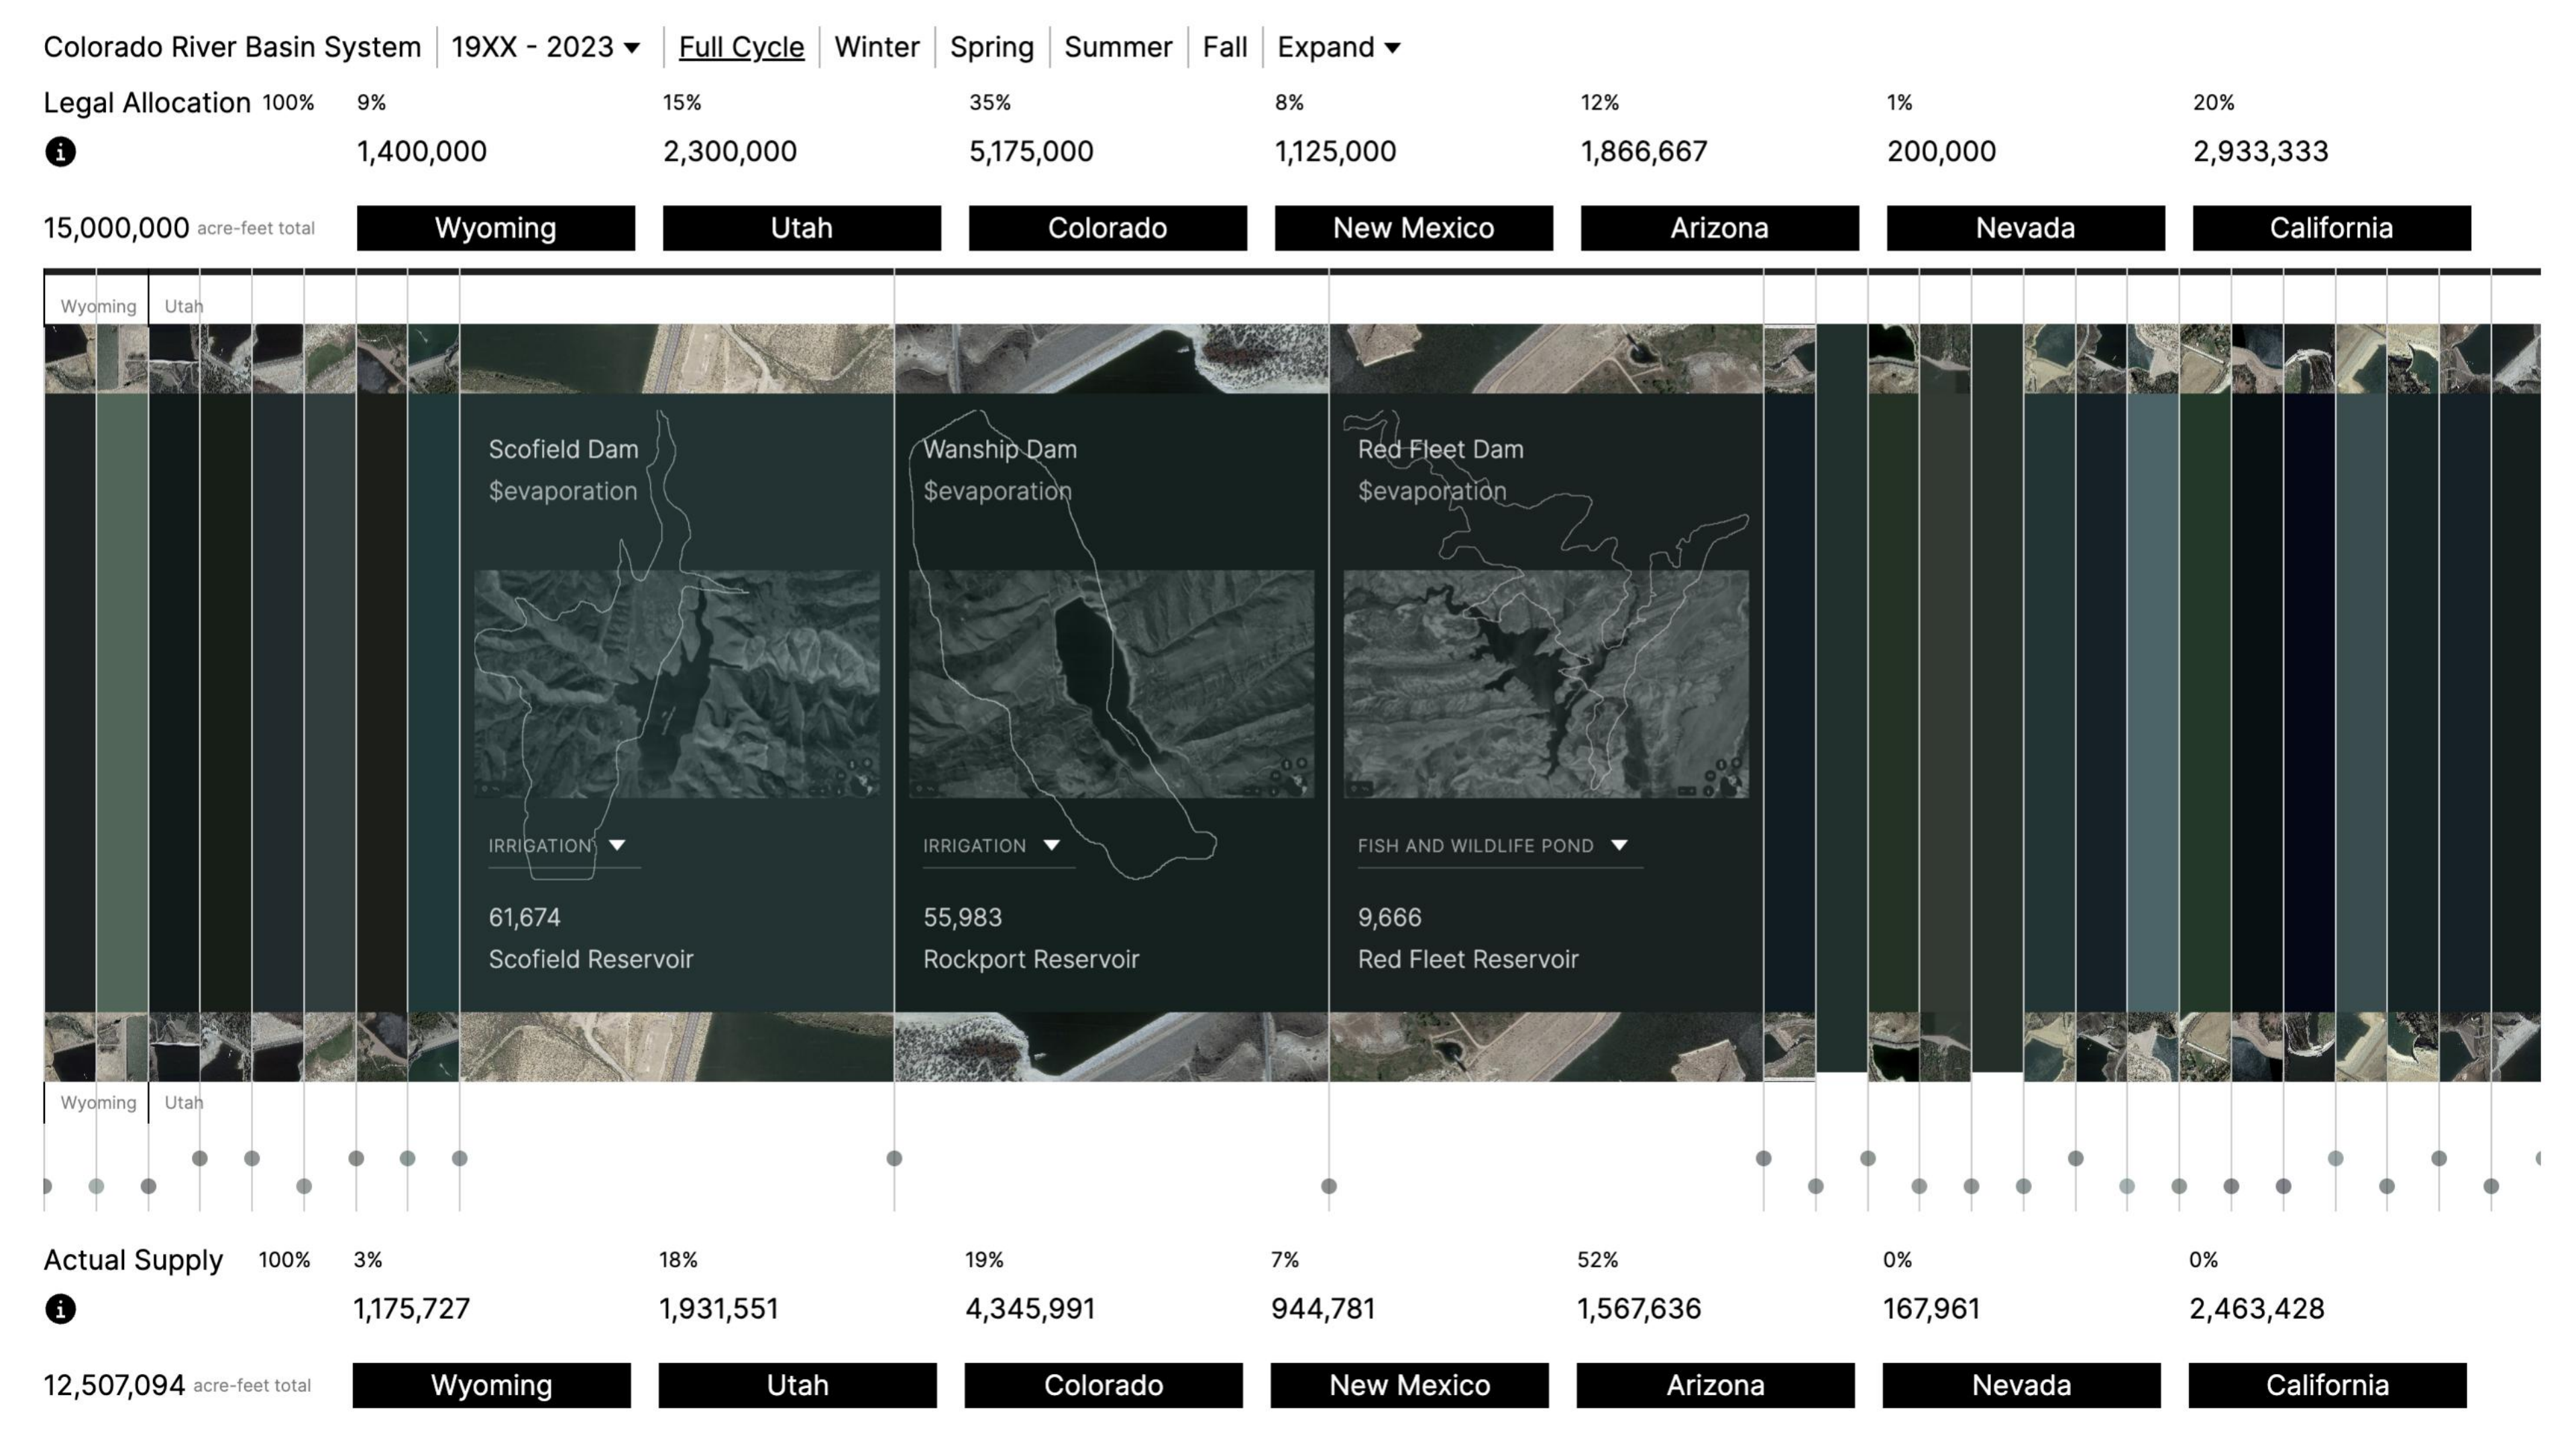
We decided to focus on Water Allocations data through a Streamflow design concept. I extended the initial conceptual design prototype into a logical design prototype by processing and modeling the data gathered with design-first intent. Where the first phase had no interactions involved with snapshots of the interface only, I moved into building dynamic interactions into this phase to get into deeper design discussion. This phase brought in real data with real interactions.
Drought / Water Rights / v2
06Dynamic Prototyping
06
06Dynamic Prototyping
Visualization Design
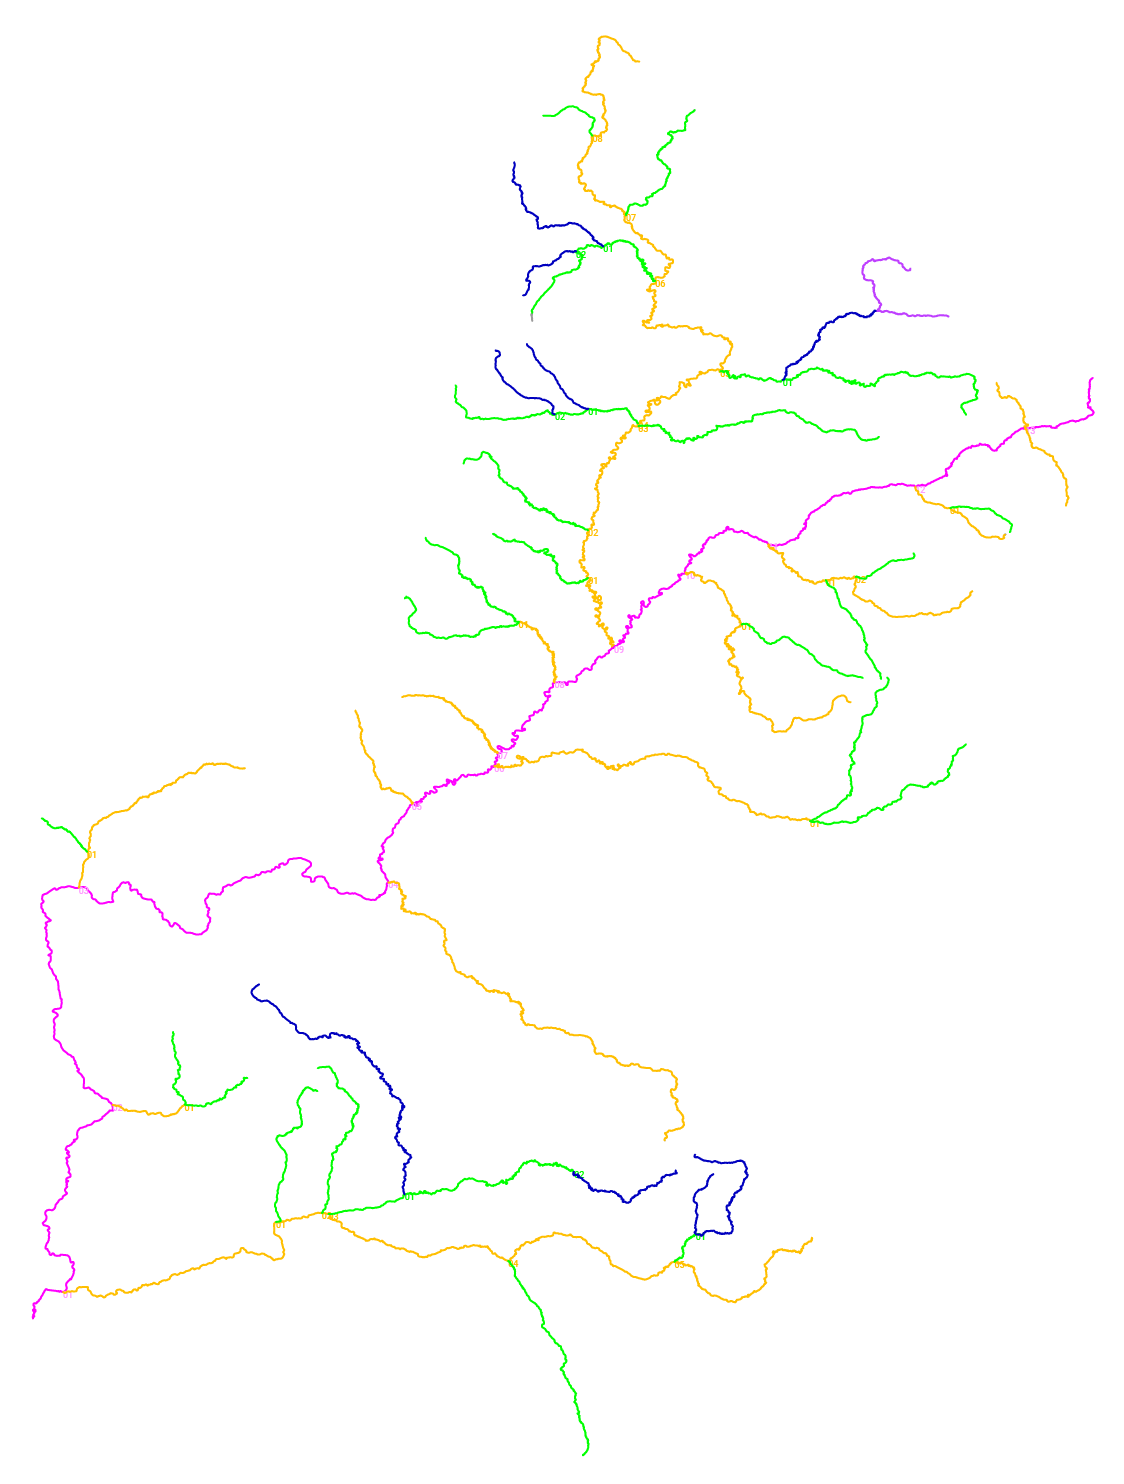
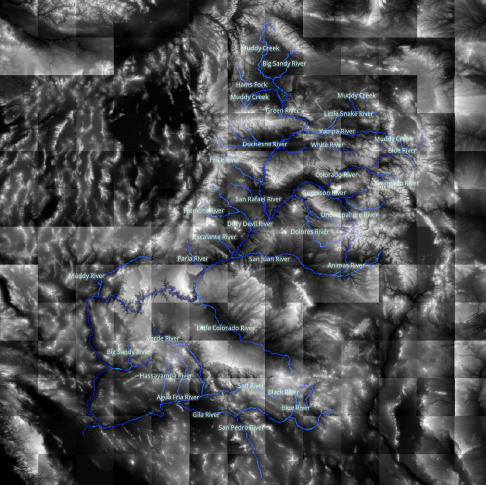
Iterations were made to explore how the Colorado River System could be visualized independent of its natural form to create an interface that was not a literal map.
River Network Structure
The river system was structurally classified according to its branching relation to the main stem. Doing this outputs a Strahler number which describes the branching complexity of the system through a hierarchy of tributaries. For the CRB, the complexity reaches a Strahler number of seven. The seven levels were then quickly mapped to color prototype a visuallzation.
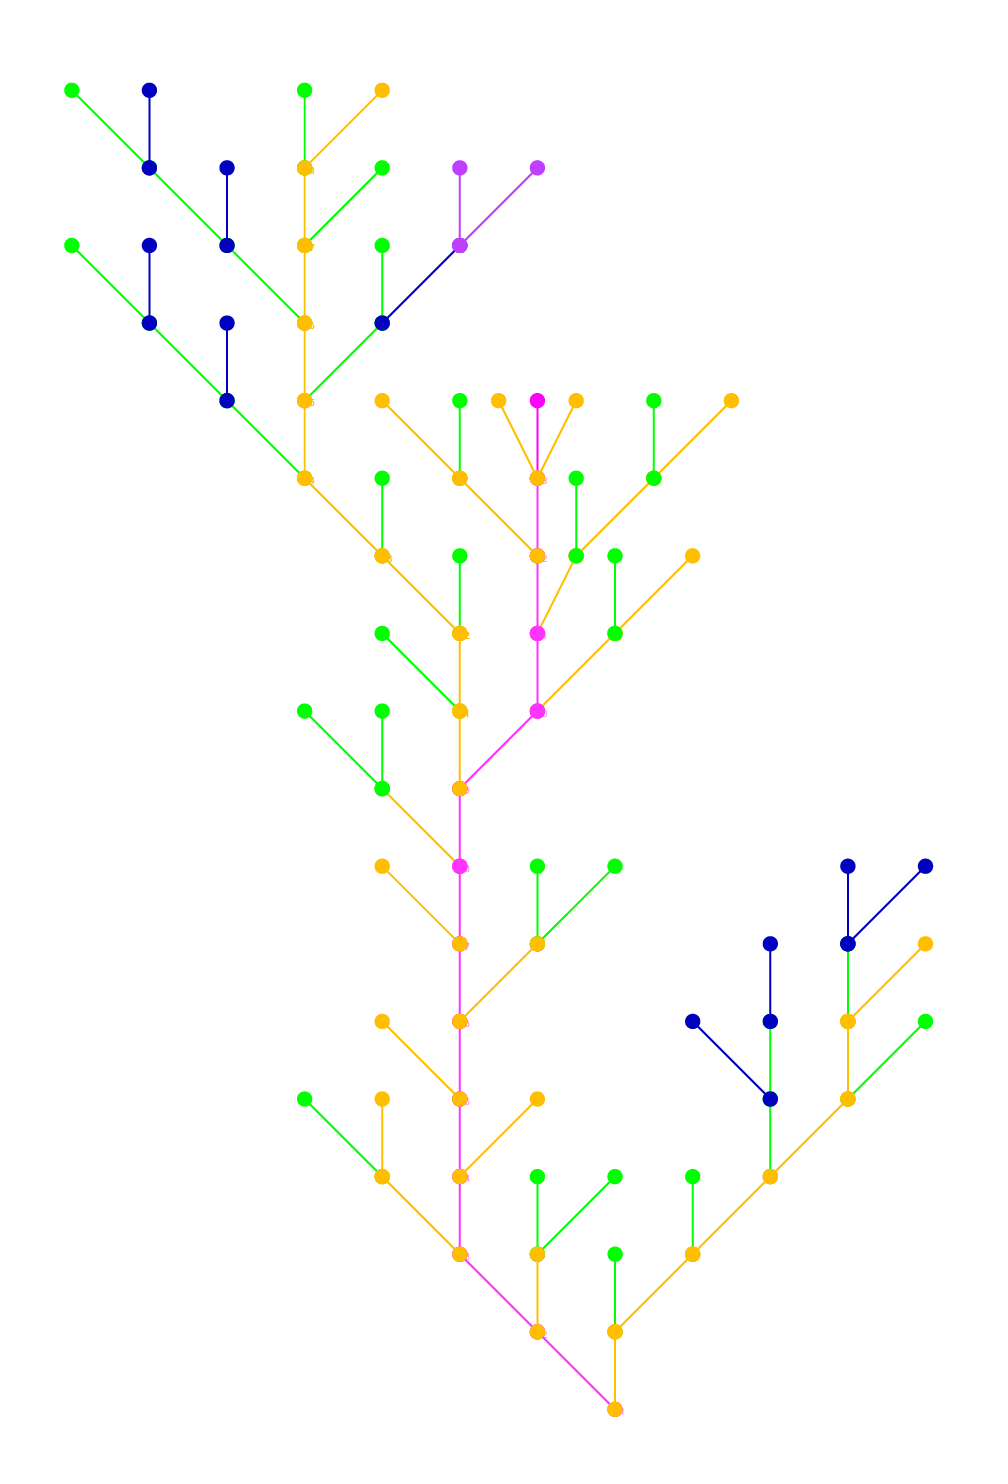
River Modularization
Each branch of the river was reduced into a line between two nodes to create a modular component. The language was then applied across all branches in the river network, according to a simplified spatial orientation that reduced angles to increments of 45 degrees.
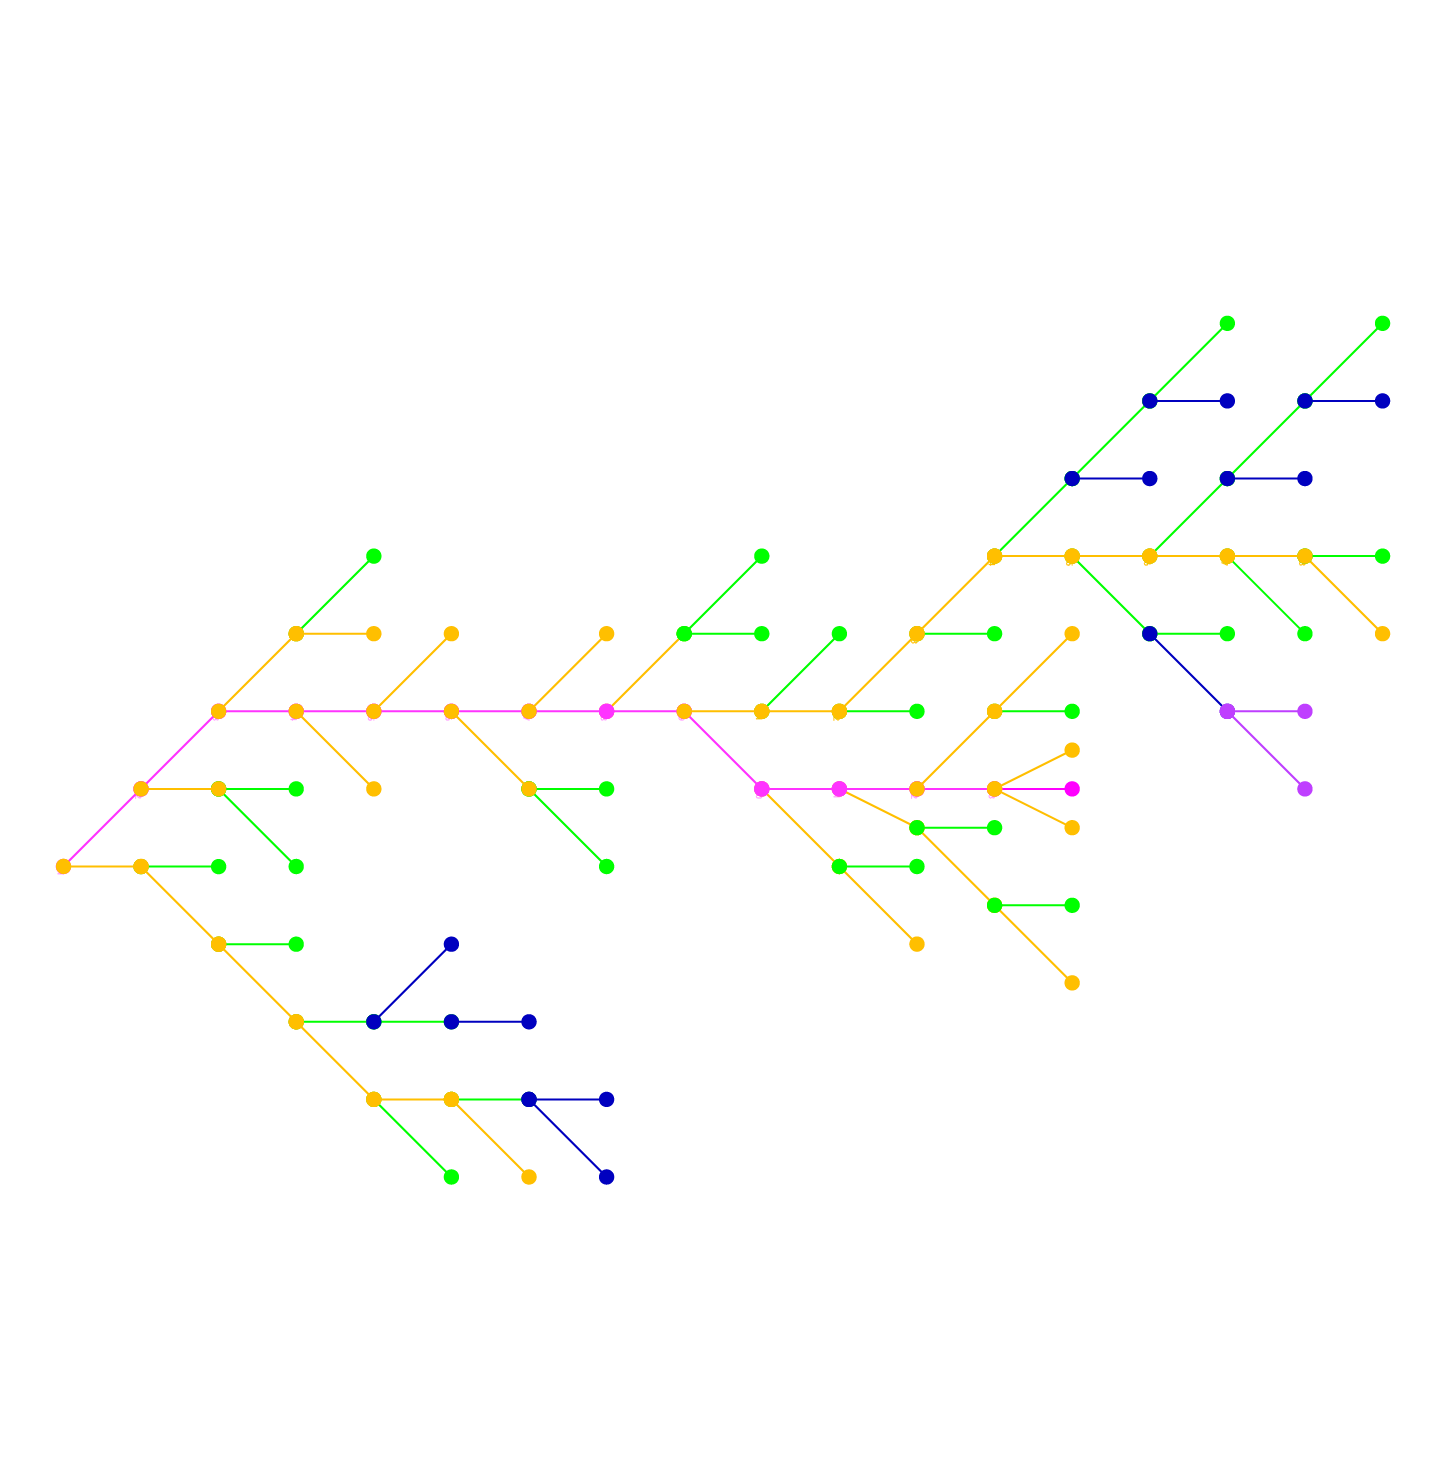
Display Re-Orientation
Flowing from east to west to match its hydrological reality, the river network was rotated 90 degrees to match the landscape orientation of the default display of a desktop computer.
07Visualization Design
07
07Visualization Design
Visual Design
As the concepts were prototyped, visual design for look and feel was continually refined for the underlying data.
08Visual Design
08
08Visual Design
Final Application
After leading the client through the conceptual and design research phase of the project as well as developing preliminary visual direction, the engineering team took over final production as I had to leave the project for other opportunities. In my time there we were able to attain scope for an introduction page to the interface, and the data design and streamflow concept was approved. After my departure, the team made the technical decision to build final application on Mapbox which constrained the rest of the design. A later design team created the interface onboard sequence.
Drought Interface Trailer
Streamflow Scenario Modeler
Data Layers
Rethinking Drought / Introduction
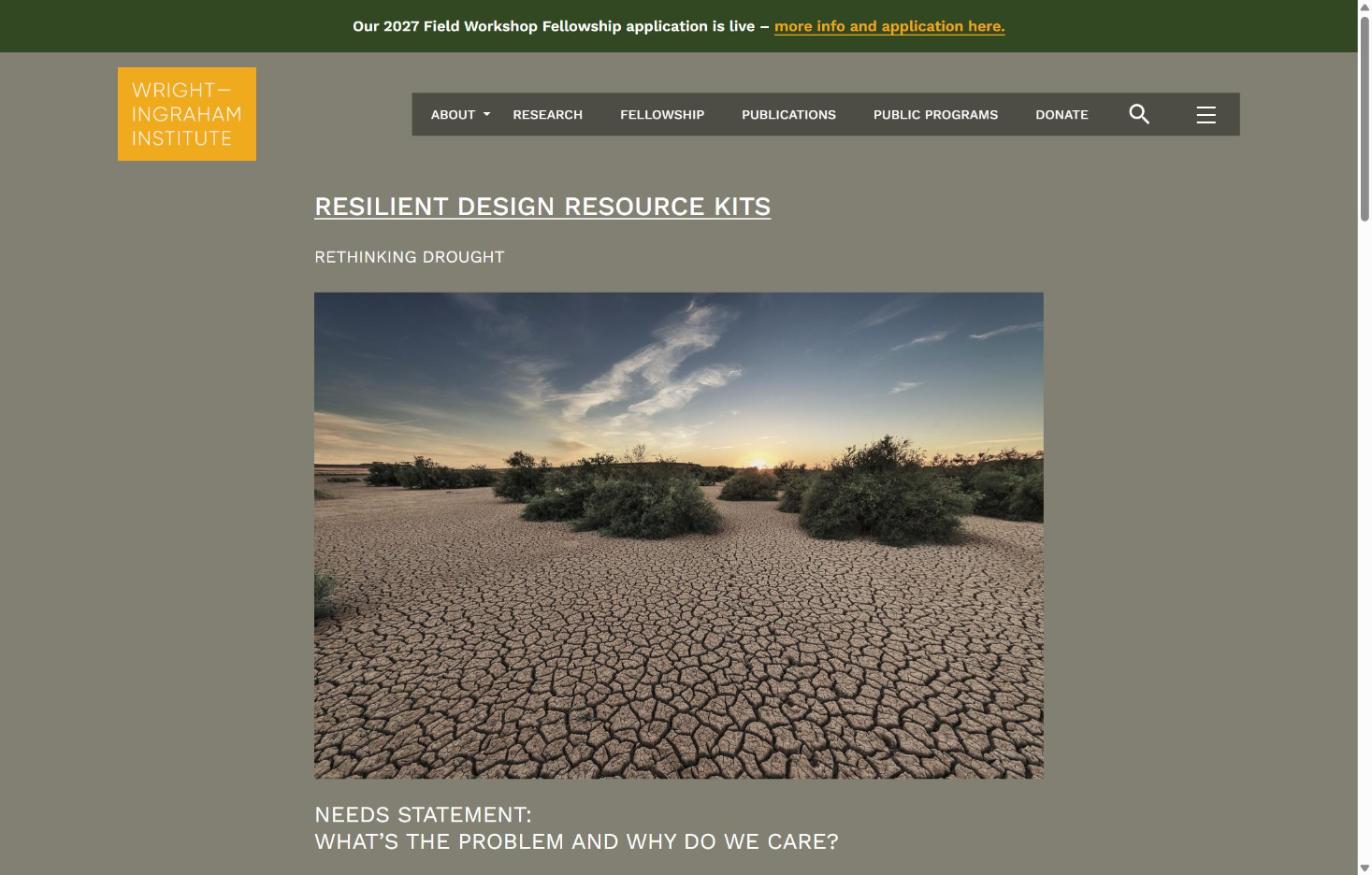
Rethinking Drought / Drought Interfaces / Introduction
09Final Application
09
09Final Application
WaterWater