201920192019
CHAMPVis: Comparative Hierarchical Analysis of Microarchitectural Performance
A multi-scalar visualization for optimizing the computational performance of neural networks.
Harvard University Architecture, Circuits, & Compiler Group
Data Visualization Designer & First Author
About
Energy costs for data centers are dependent on the computational performance of neural networks. Identifying performance bottlenecks requires navigating through the microarchitecture of semi-conductor chips, but current interfaces do not enable the comparisons of different algorithmic designs. CHAMPVis is an interface that enables performance bottleneck identification of machine learning processes.
Research Motivation
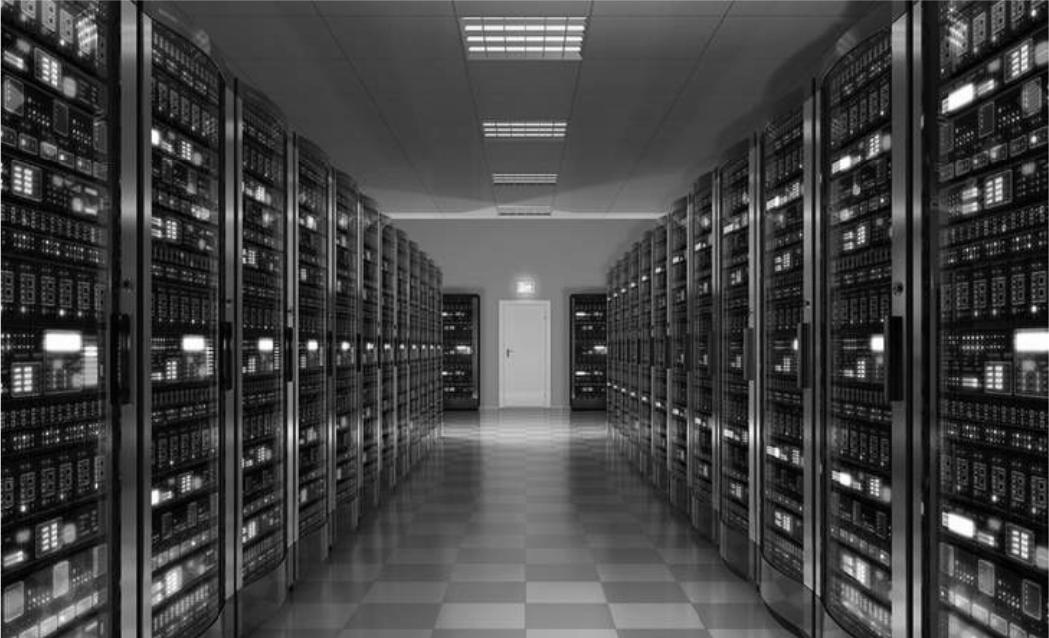
Machine learning algorithms are used to enable features throughout many applications today. Over time, increasing adoption will create pressure on energy production. Use cases were collected to illustrate past and future scopes.

Real-time Facial Recognition
Social Media (Snapchat, Instagram, TikTok, etc.)

Real-time Shortest Path Recommendation
Navigation (Google Maps, Uber, etc.)

Real-time Voice Recognition
Smart Home (Amazon Echo, Siri, etc.)

Vehicular Navigation
Autonomous Vehicles (Tesla, Uber, etc.)
01Research Motivation
01
01Research Motivation
Research Design Engineering
Working with researchers in computer architecture, there was an organic understanding of the domain problem. While a research goal was quickly formalized, the technical problem was complex.
The system was re-modeled to streamline optimization.
The system was re-modeled to streamline optimization.
Research Goal
Enable productive and detailed profiling of computer system hardware and application software by visualizing performance counters.

System Modeling
Understanding the computational impacts of hardware on software and software on hardware is a many-to-many problem architecturally. This is compounded when computational resources are distributed and not co-located on a single machine. An object was conceptualized to track the relationship between hardware and software for performance.


02Research Design Engineering
02
02Research Design Engineering
Task Analysis
In order to understand how performance counters should be developed, we needed to understand the existing task flow. Interviews were done with computer architects to identify questions asked during the process of trying to find a bottleneck that is worth optimizing.
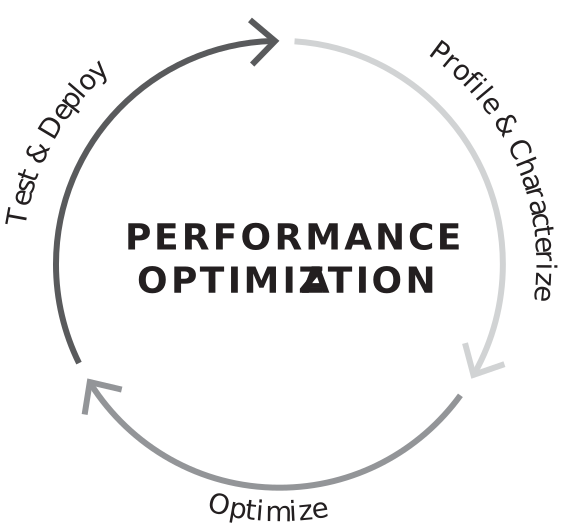
Performance Optimization Cycle
Performance optimization is an exploratory task that requires identifying performance bottlenecks. An open-ended problem, the process is cyclical.
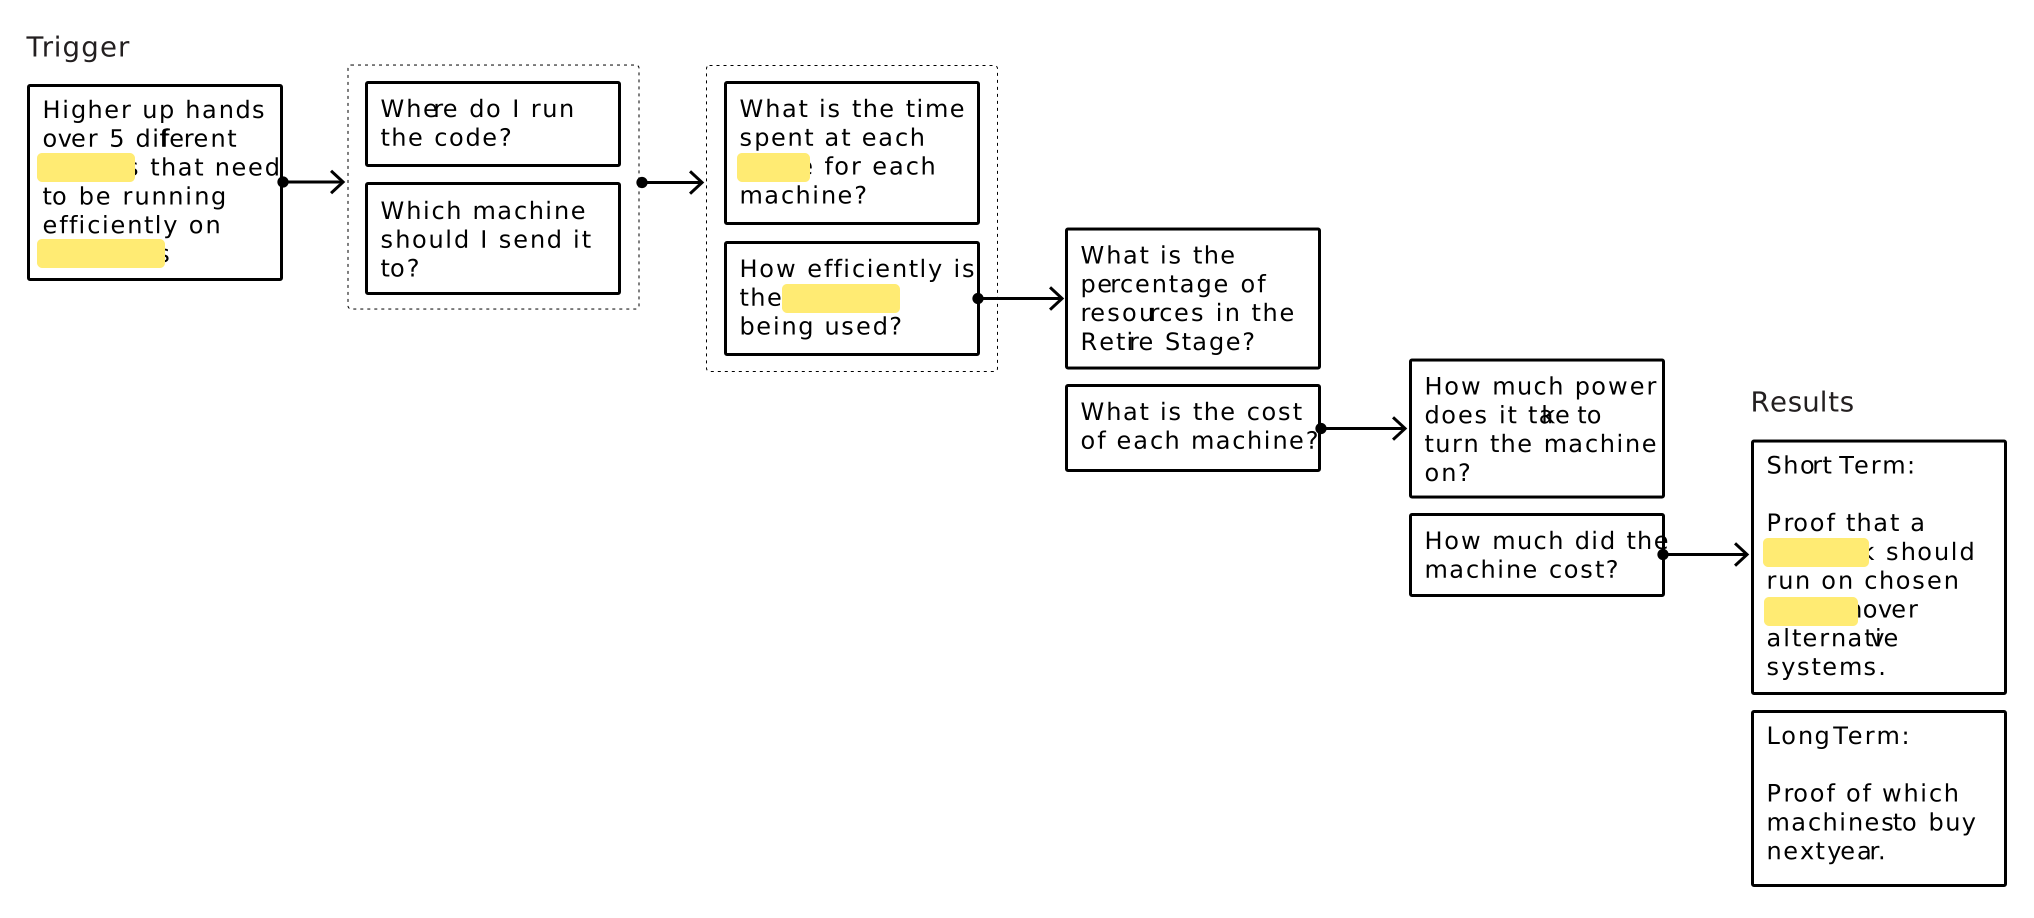
Performance Targeting Flow
Identifying and targeting performance bottlenecks requires balancing technical and business needs.
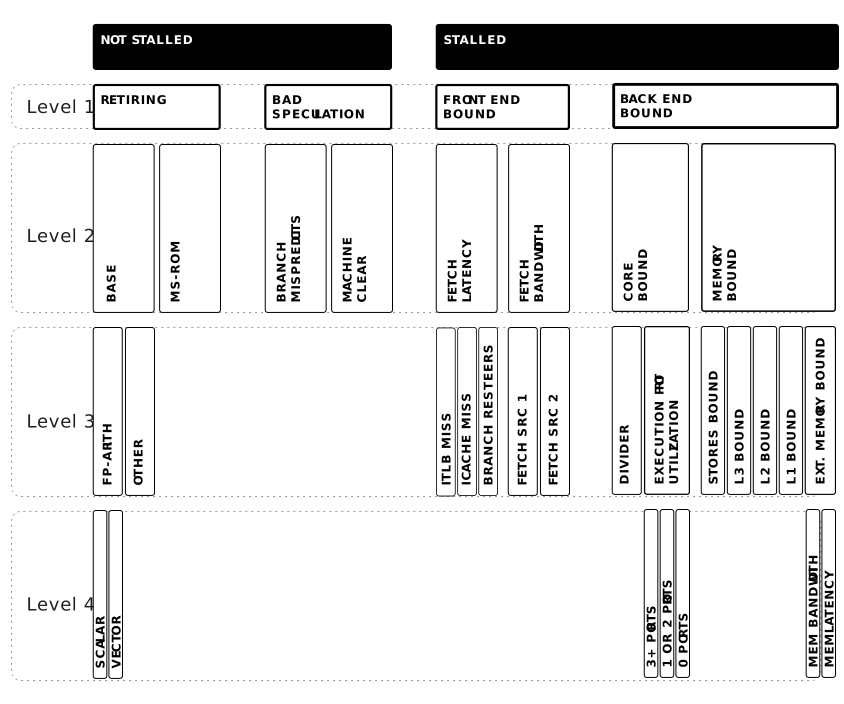
Bottleneck Identification System Architecture
In order to navigate a complex task, computer architects use a variety of system architectures to help them debug architectural problems. We decided to use Top-Down Microarchitectural Analysis because it is a common standard. The diagram illustrates the different levels of drill-down, starting with whether an application state is stalled or not-stalled.
03Task Analysis
03
03Task Analysis
Requirements Synthesis
1
Guided Bottleneck Analysis
Navigation through microarchitecture is guided to allow quick navigation and drill-down into algorithmic performance.
2
Granular Performance Comparisons
Comparisons of granular characteristics for different software running on different hardware at all levels of the microarchitecture allows detailed targeting and optimization.
3
Summative Performance Comparisons
One-dimensional visual summaries for different software running on different hardware allows high-level comparison.
04Requirements Synthesis
04
04Requirements Synthesis
Comparative Research Papers
Papers with the same data visualization research goals were reviewed and analyzed for research gaps.
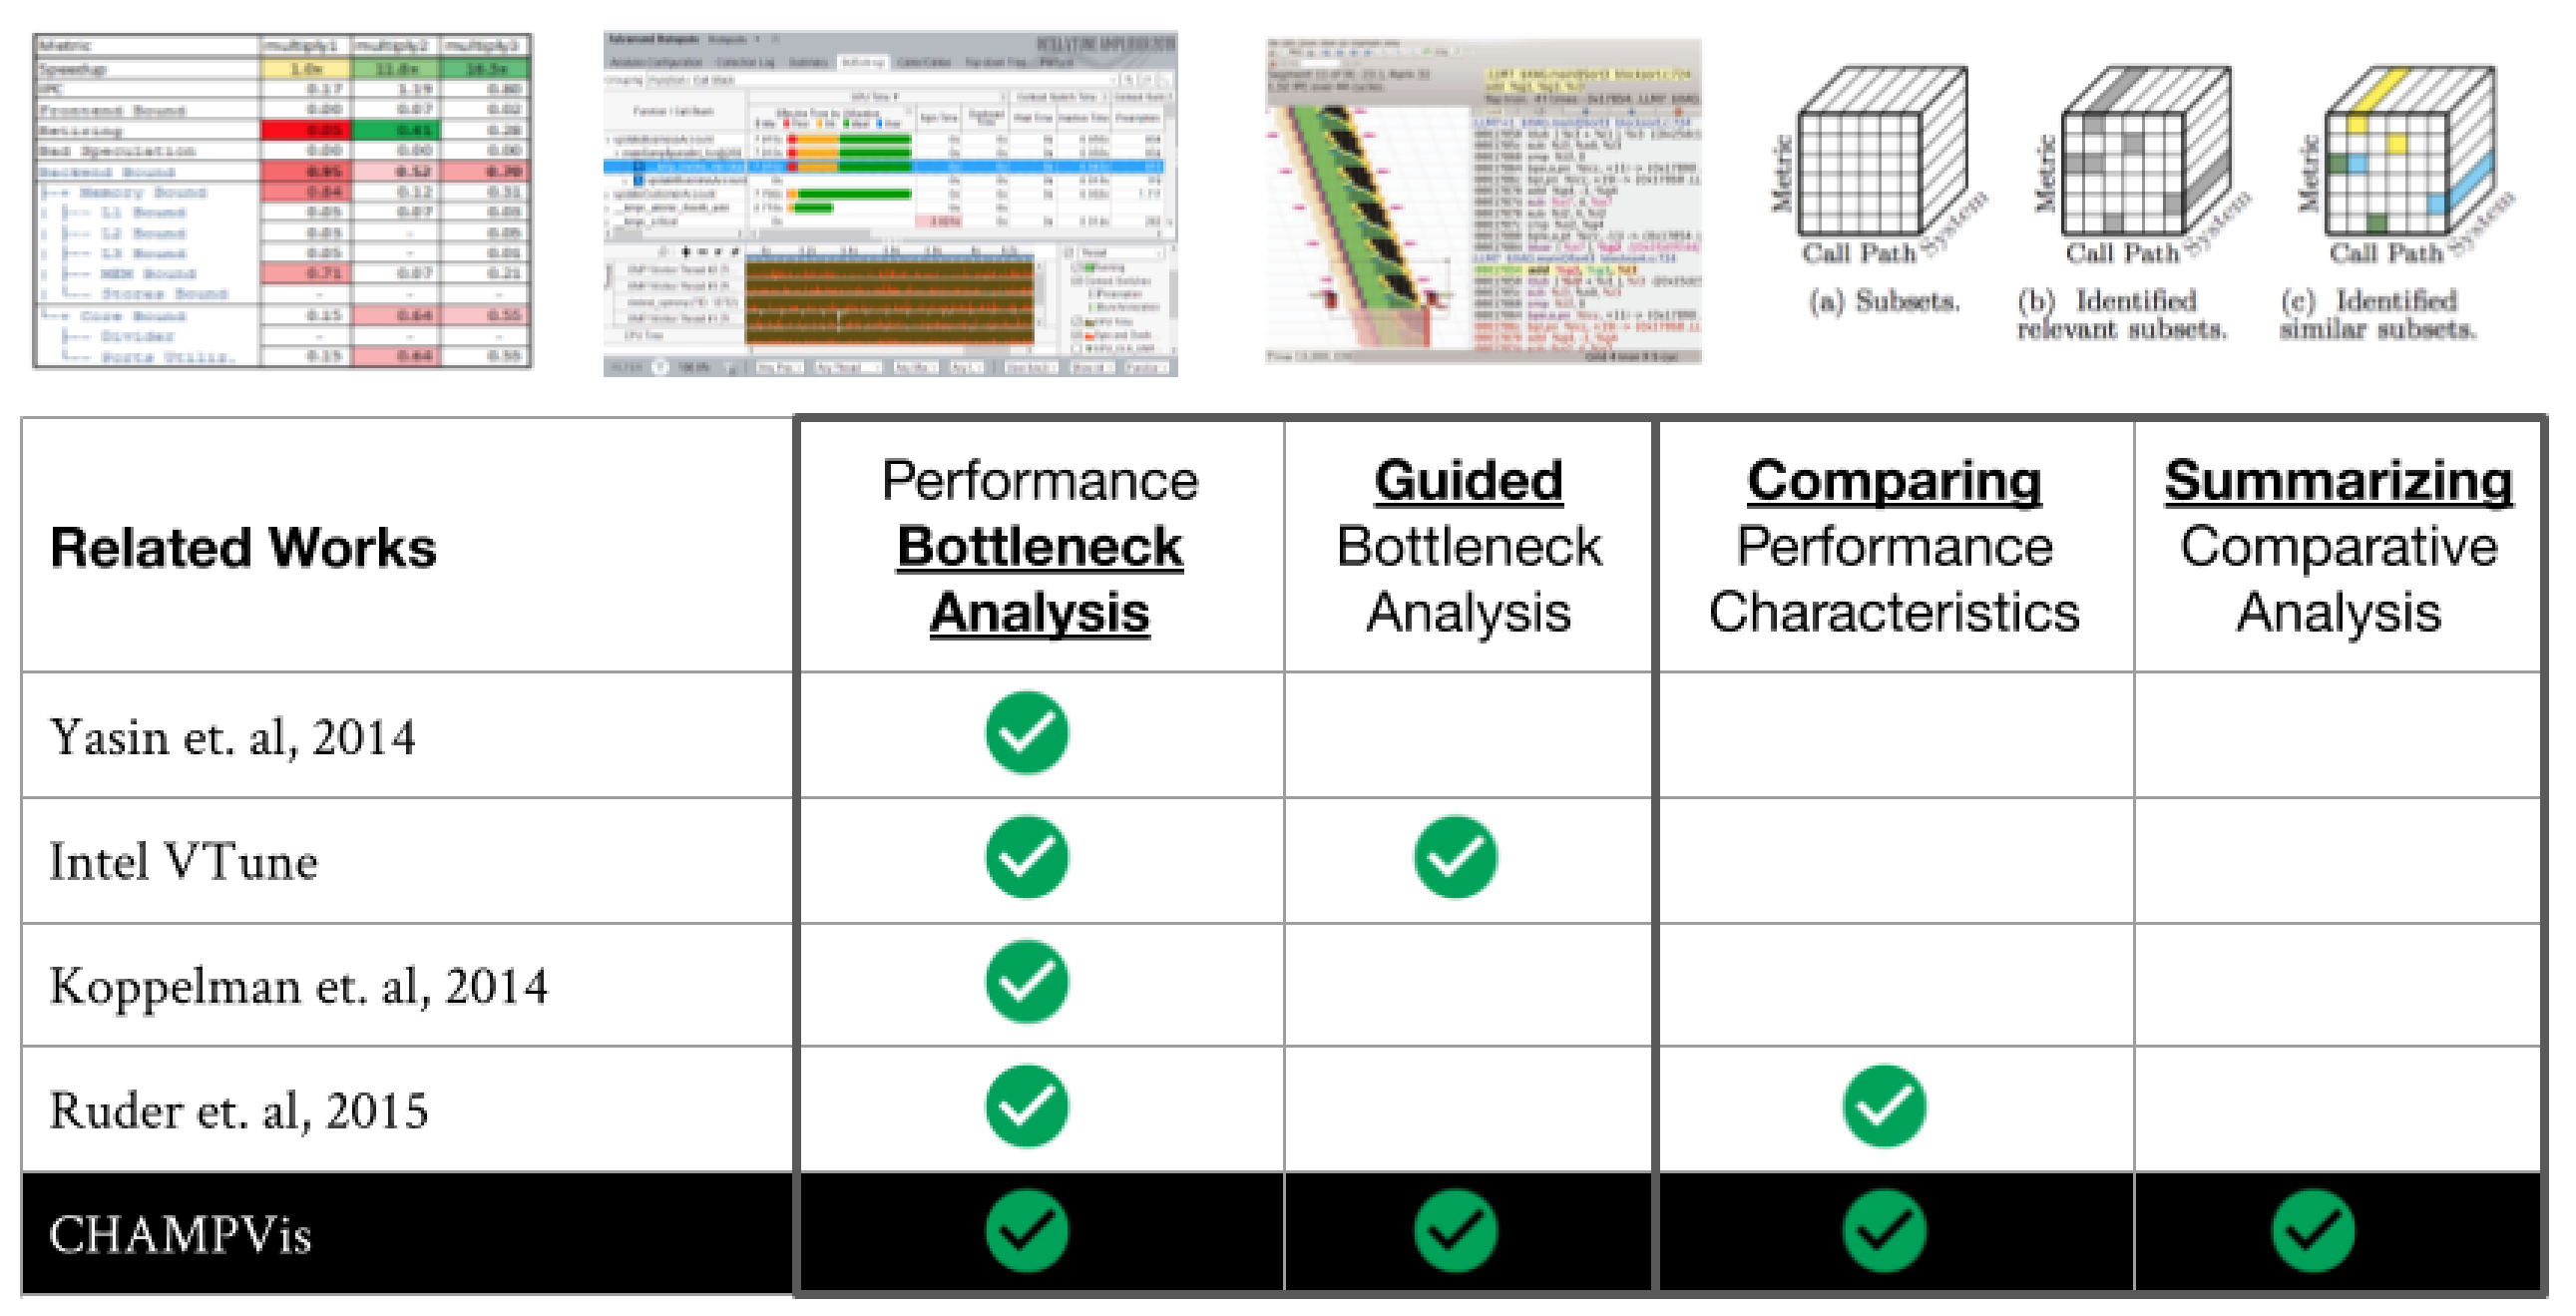
Task Parity Matrix
By conducting a task analysis beforehand, it became clear that while related works had tackled parts of performance analysis, no visualization captured the full flow to enable optimization.
05Comparative Research Papers
05
05Comparative Research Papers
System Design
A new computational system was developed to trace and analyze performance data.
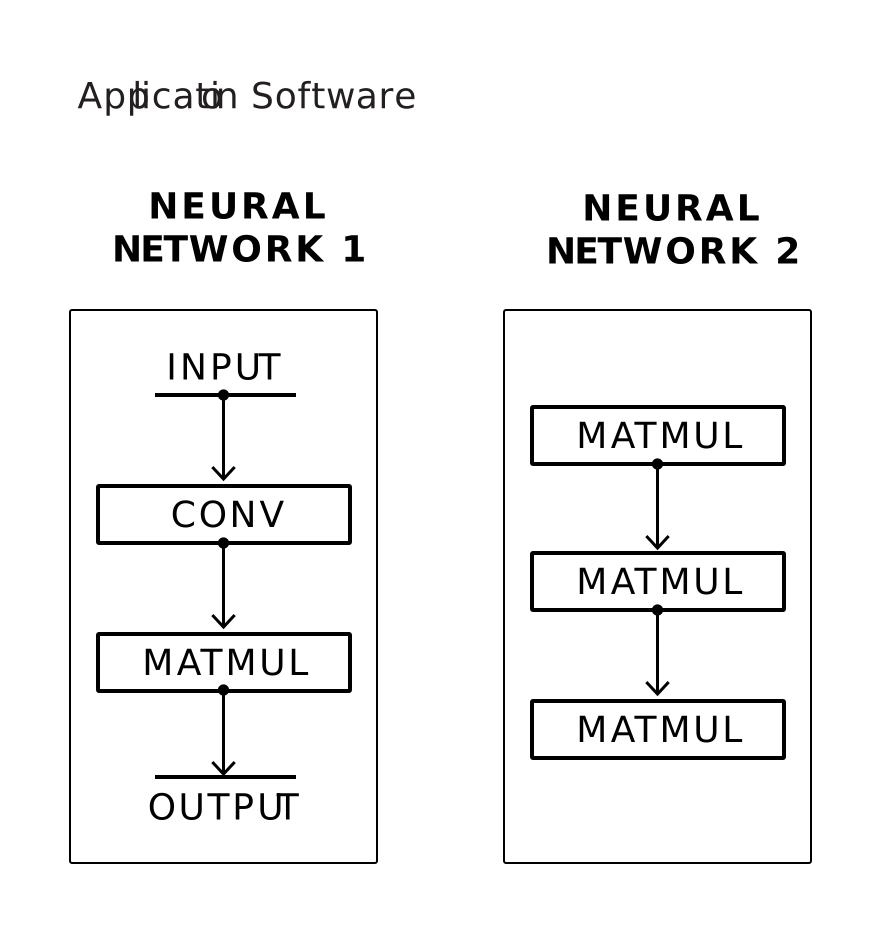
Neural Network Comparisons
In order for comparisons to be possible, more than one neural network would need to be stored and analyzed in a single visualization system.
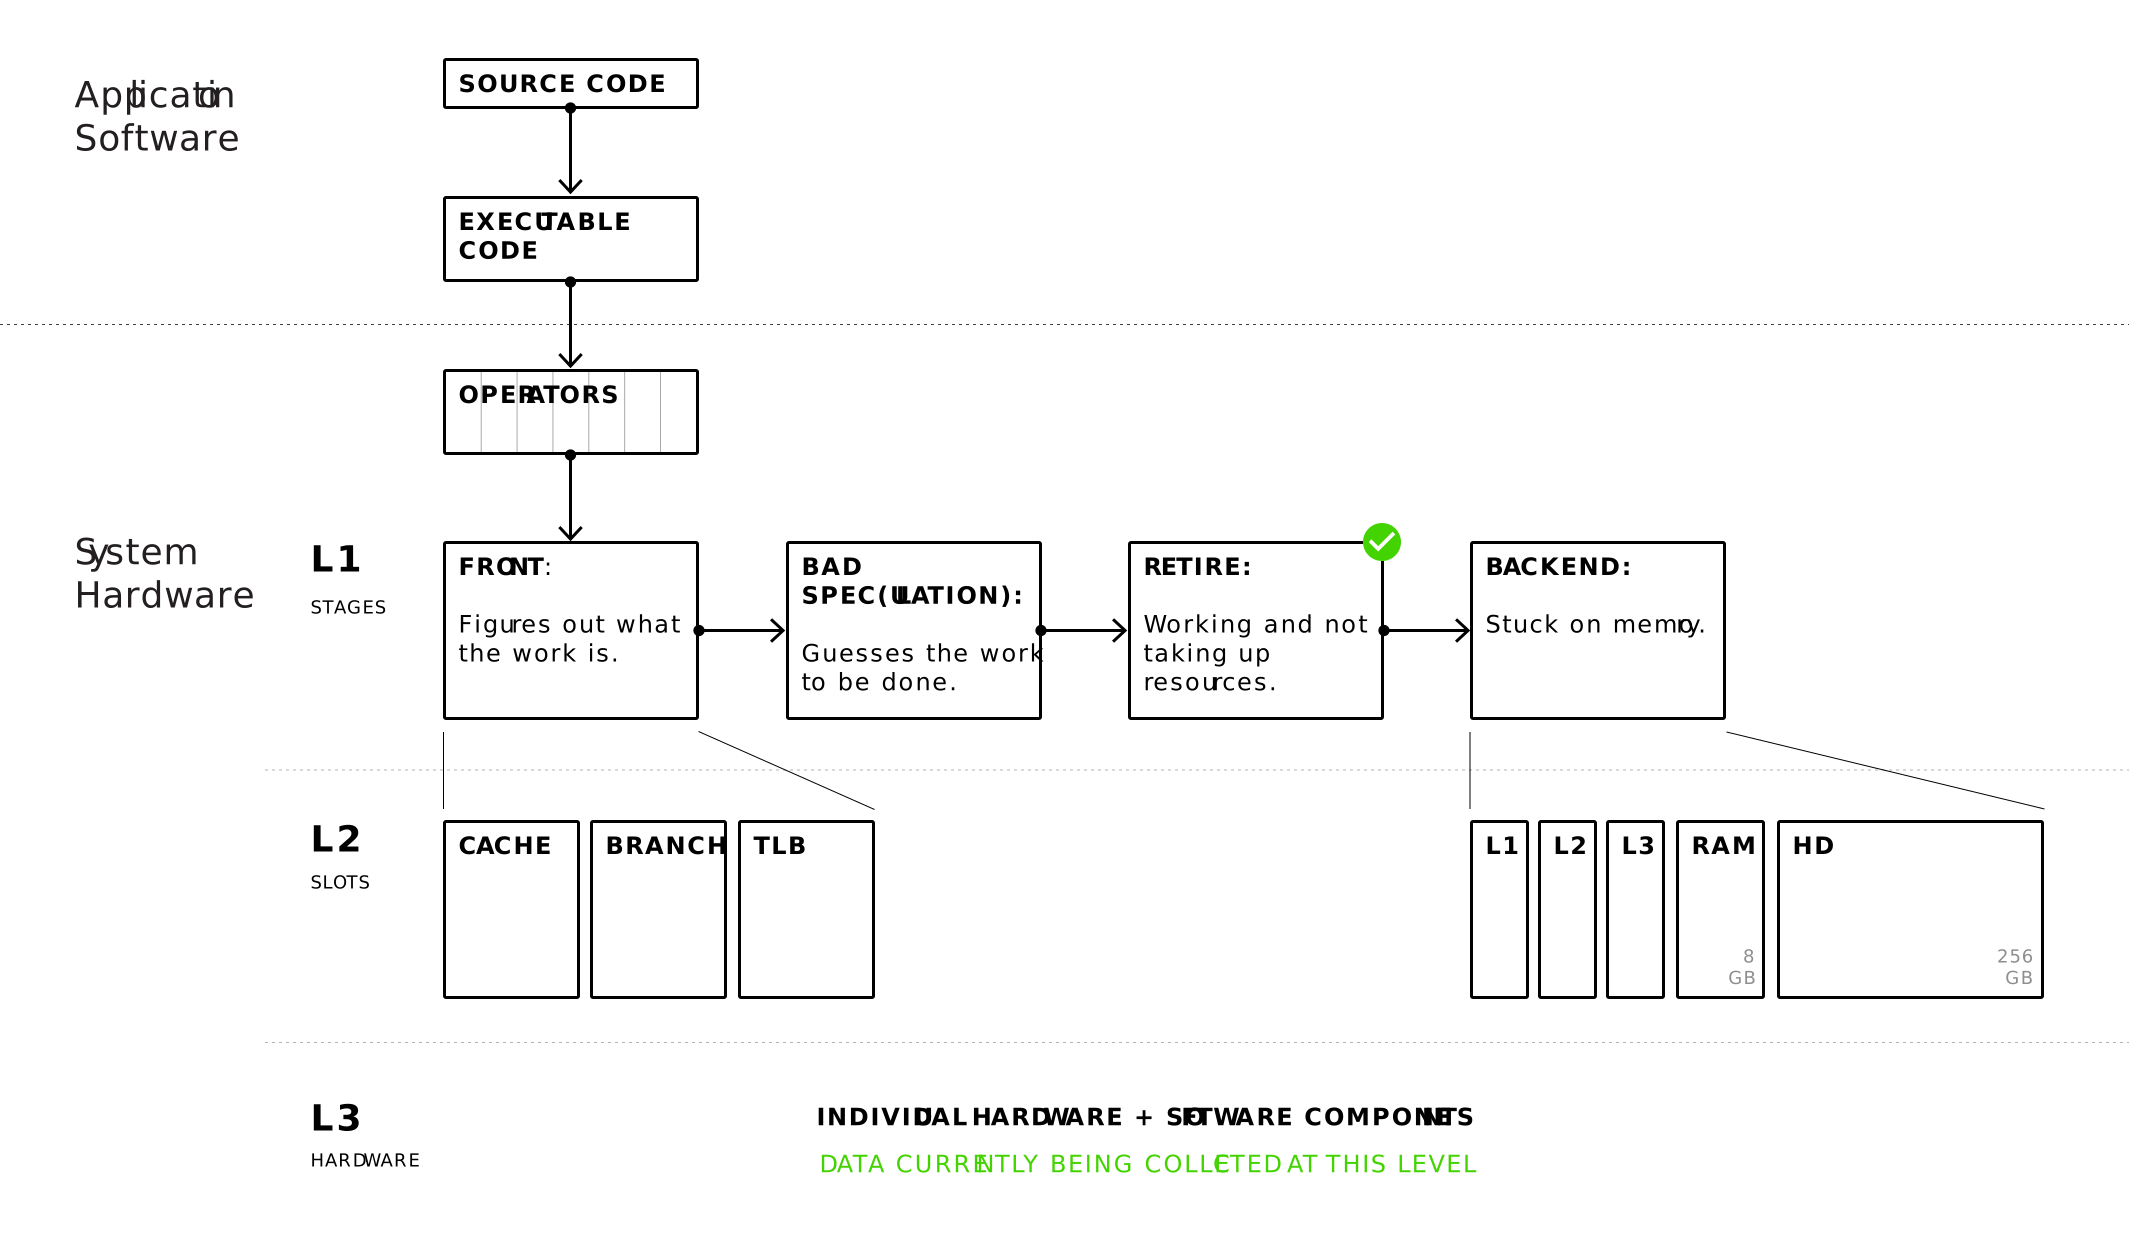
Data Flow
Source code for the neural network would need to be injected into the microarchitectural structure to trace the data flow and compute performance.
06System Design
06
06System Design
Interface & Interaction Design
Static prototypes were quickly created to collaborate with the team and communicate ideas around position of components, navigation, interactions, and color.
CHAMPVis / Parallel Coordinates
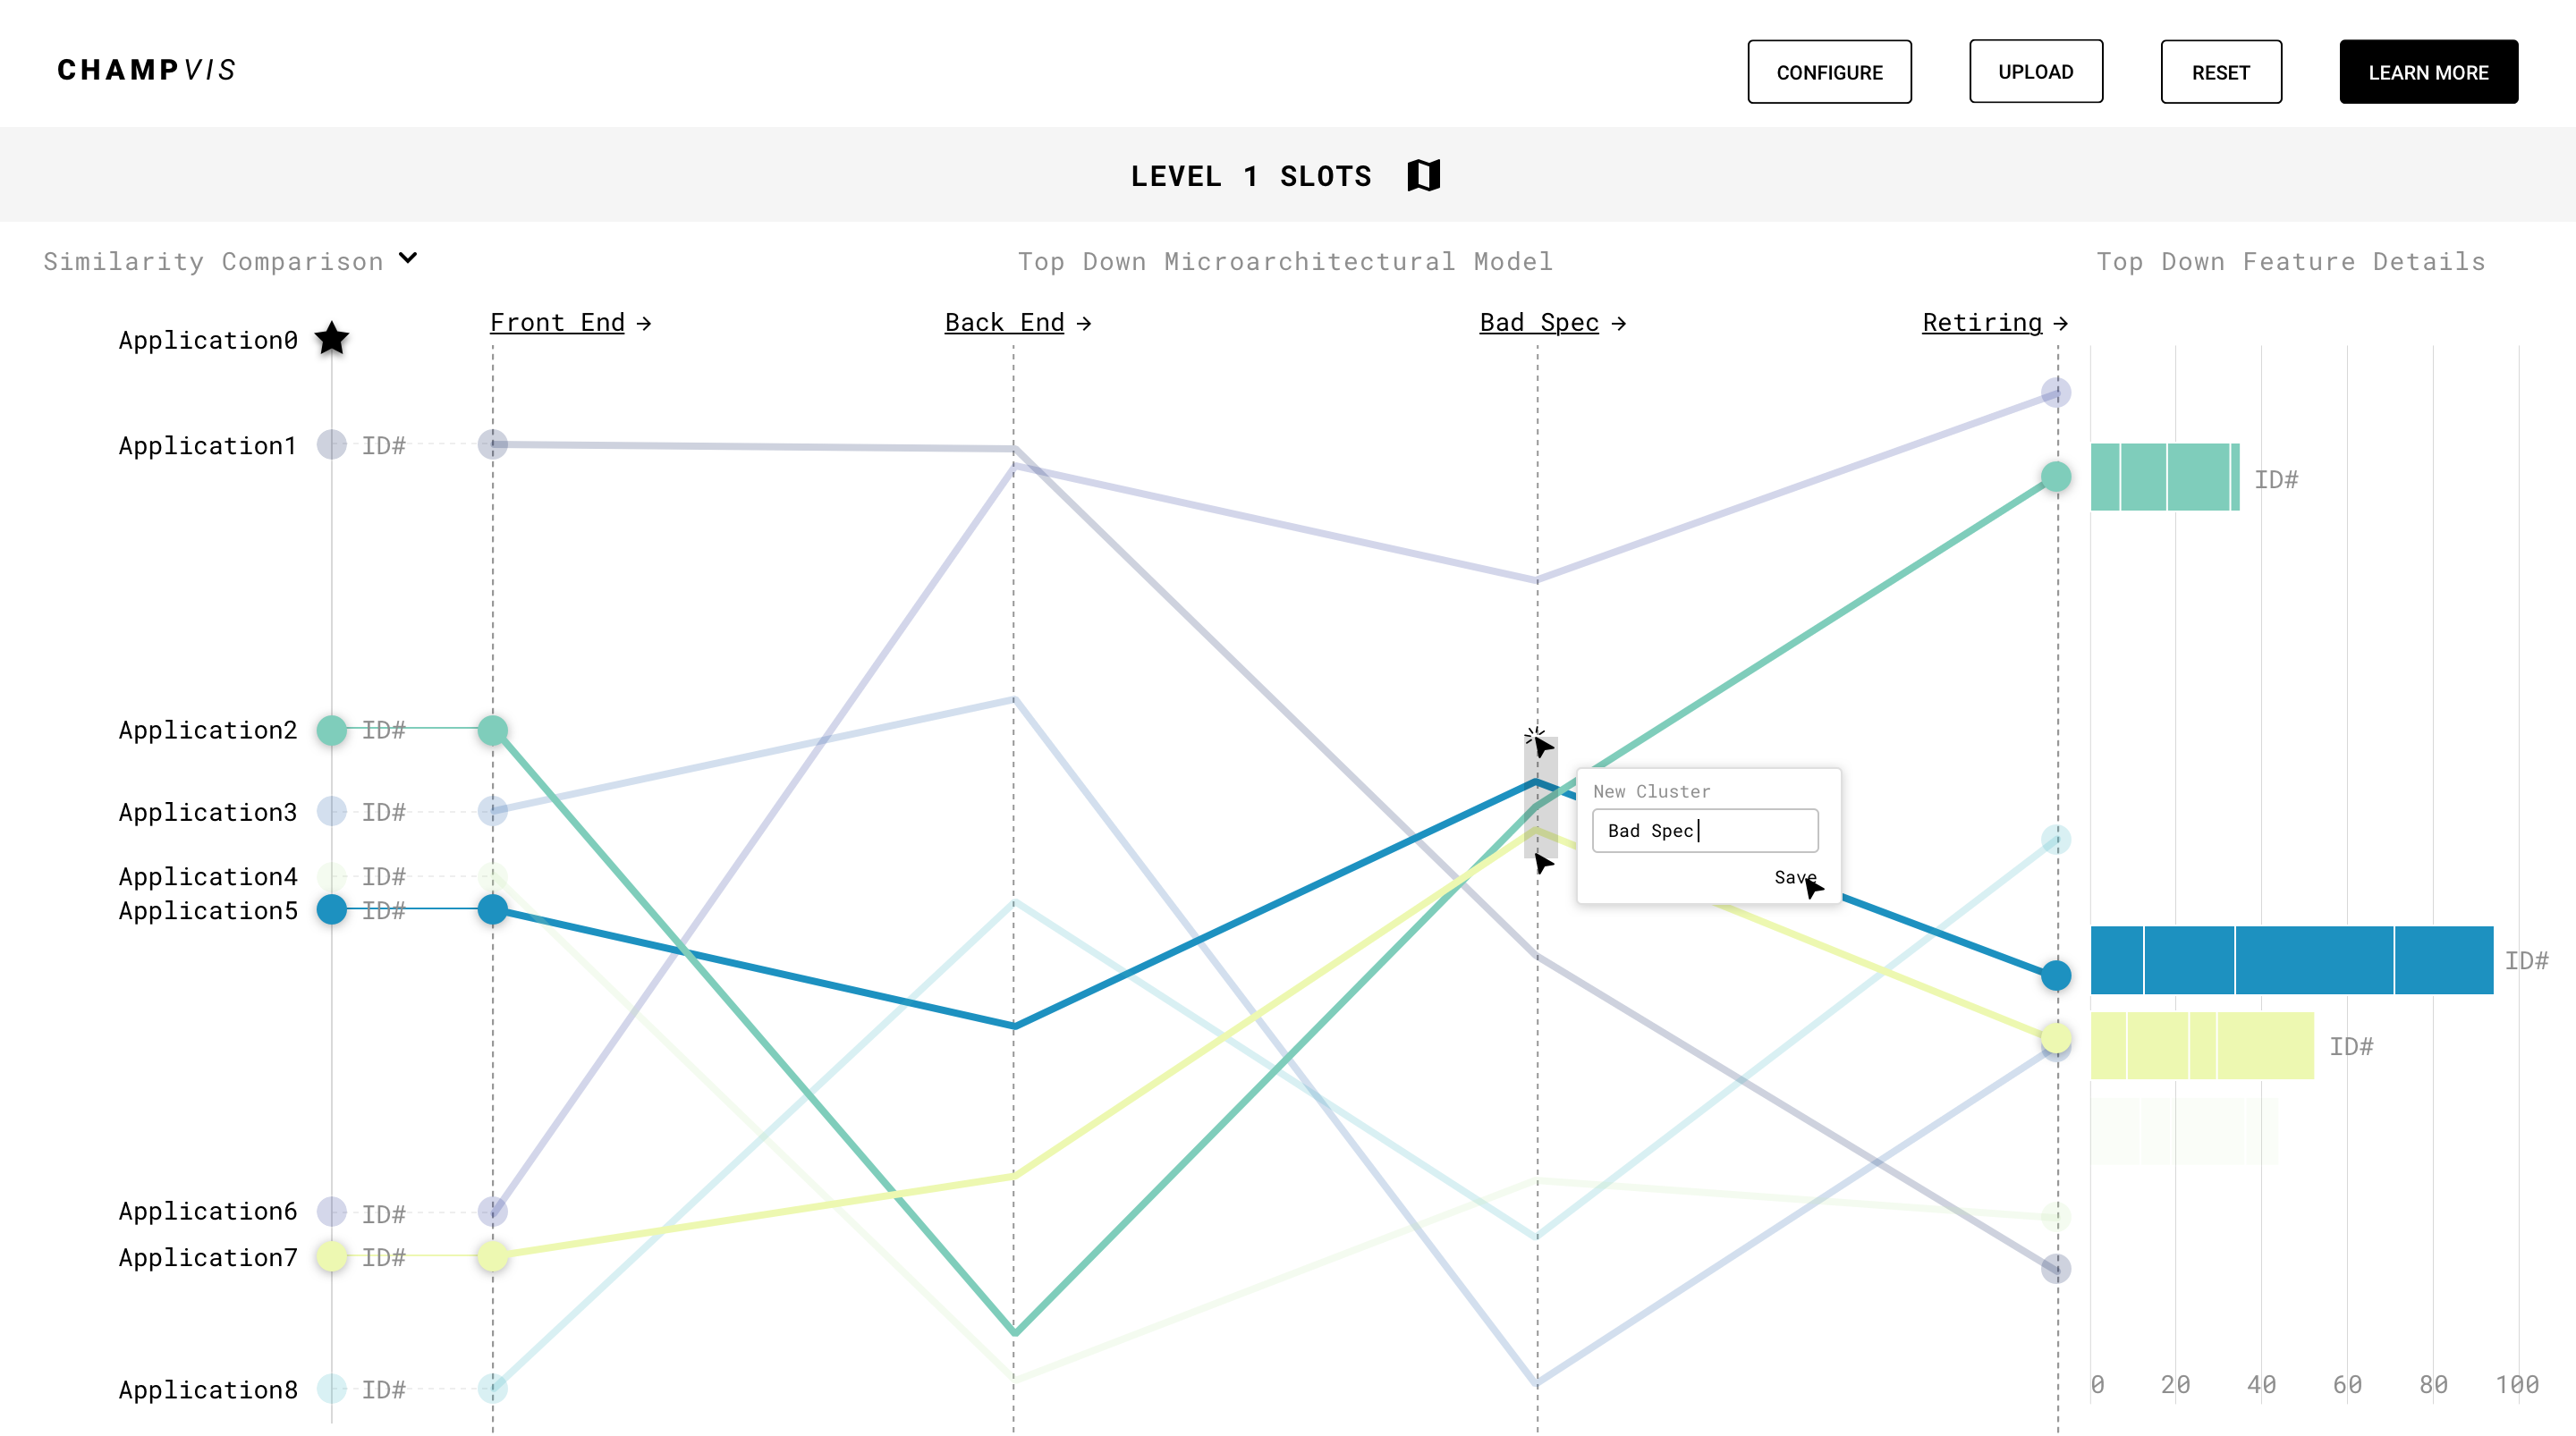
Parallel Coordinates
Given the progressive navigation through the microarchitecture for many applications, we decided to use parallel coordinates for the primary visualization.
07Interface & Interaction Design
07
07Interface & Interaction Design
Research Paper
Our research paper was accepted to the 2019 ACM / IEEE Supercomputing Conference.
08Research Paper
08
08Research Paper
Machine LearningMachine LearningPerformance OptimizationPerformance OptimizationEnergyEnergy